
Personal Robots on the Horizon: The Robot Operating System

By Slider, Ubicomp2012

We are over in Pittsburgh for Ubicomp 2012, kicking off the 5 day conference is Steve Cousins, President and CEO of Willow Garage, a robotics company that acts a a catalyst to create a new industry in personal robotics by creating open source software and state-of-the-art robot hardware.
Robots are not close to being ubiquitous, but we are getting closer to a day when personal robots will be commonplace. Robotic technologies, with either sensing or actuation, are rapidly being adopted as advances in computation allow us to do more with them. Robots are following a path that parallels that of computing. Mainframe computers and industrial robot arms are both large, expensive devices that operate behind locked doors on behalf of an organization. Like personal computers, personal robots are used directly by individuals to increase their effectiveness in whatever they do.
Steve notes that Personal Robotics is a new industry powered by open source software with off the shelf components.
The Person Robot 1 in 2007 provided a first glimpse of home personal robots:

 
Moving on to the Person Robot 2 was introduced in 2010, small scale and high cost but 40 of the units are currently in use in a range of applications, the progress from 1-2 points to the developments most notably version 2 is autonomous:
 
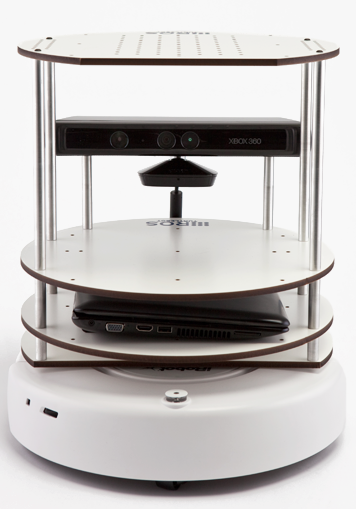
The main issue is software rather than hardware, core to this is the development of a Robot Operating System (ROS). Below is the Turtlebot, basically a Roomba linked to a Kinect and running ROS, we really like this one:
 
As Steve notes these developments prompt thoughts of the forthcoming film Robot and Frank:
 
In the near future being able to ‘manipulate the world’ from a distance – ie the PR1 will be more common, cost is still an issue but smaller off the shelf hardware, combined with ROS and open source is bringing personal robots into the foreseeable tech horizon.

Live London Dashboard now with realtime Olympic tweet counter

By Front Page

Ollie here in CASA has just posted a new temporary panel on the London CityDashboard which shows Twitter activity at the London 2012 venues. The panel is using data from new Twitter collector tools in the Big Data Toolkit, developed by  Steven James Gray, again CASA, as part of his PhD.

As Ollie notes ‘for each venue, the collectors count the number of Tweets in the last hour that have latitude/longitude information stamped on them, that are located within an area radiating around the centre of each stadium or arena. Its worth noting that this excludes the majority of relevant tweets, as most mobile Twitter applications don’t include this information by default’, you have to turn on Geo Location.

So far the Olympic collectors set up by Steven (@frogo) have 22 machines each collecting Tweets from each of the Olympic venues all over London and we have managed to collect over 1.4 million tweets from the last 14 days of the Olympics (Each has been sent from the vicinity of each venue hence why the individual numbers are low).
The Big Data Toolkit will be entering a beta testing phase in the next couple of months, to allow anyone to collect and map tweets – the aim is to make it as easy as possible while also maintaing the feed for data analysis.
You can view the live data either within our other feeds via our London CityDashboard or direct at http://bigdata.casa.ucl.ac.uk/olympics/
For more detailed information take a look at Ollie’s Suprageography site and Steven’s Big Data Toolkit.
 

Using Oyster Card journeys to understand how, why and where we travel in London

By Front Page, Slider

Researchers from UCL have analysed millions of Oyster Card journeys in a bid to understand how, why and where we travel in London.

Professor Michael Batty (UCL Centre for Advanced Spatial Analysis) and Dr Soong Kang (UCL Management Science and Innovation) applied the techniques of statistical physics to their mountain of raw data.

The pair joined forces with a computational social scientist and a physicist, both based in Paris, to explore patterns of commuting by tube into central London:

They used Transport for London’s database of 11 million records taken over one week from the Oyster Card electronic ticketing system.

Close Menu

About Salient

The Castle
Unit 345
2500 Castle Dr
Manhattan, NY

T: +216 (0)40 3629 4753
E: hello@themenectar.com

Archives