The 3D-GIS in the Cloud App for iPad and Smartphones allows city data to be navigated in 3D. Mixing augmented reality and 3D visualisations the App extends the reach of GIS beyond the office and allows organisations to make collaborative and accurate business decisions in both field and office environments.
The system supports existing GIS spatial data from various files (e.g. Shapefile, GDB, Multipatch, GeoTiff, ECW, GML, SDF, WMF, WFS) and database sources (e.g. ArcSDE, SQL Server, Oracle). Each data source is rendered and handled as an independent layer within the 3D model. The movie below provides a look at the app in action:
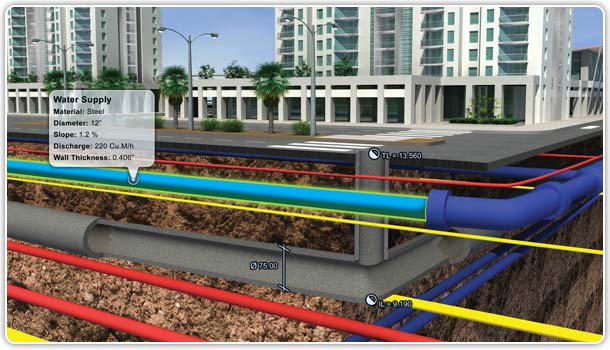
In addition to the normal GIS information the app allows 3D SketchUp models of structures or features, either existing or planned to be visualised.
We are normally sceptical about such ‘onsite GIS’ software as the reality compared to the marketing is often a long way apart, in this case we have to say the system looks impressive, for more information, visit http://www.sivandesign.com/3d-gis.
