
QRator wins the The Museums & Heritage Award for Innovation

By digital heritage, internet of things, ipads in museums, museums and heritage award, QRator, social objects
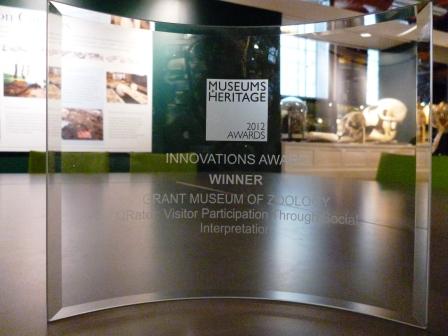
QRator, the Museum focused ‘Internet of Things/Smart Places’ project developed jointly with us here at the Centre for Advanced Spatial AnalysisUCL Digital Humanities and UCL Museums, with funding from the UCL Public Engagement Unit , has won The Museums & Heritage Award for Innovation.  Known as ‘The Oscars’ of the museums world we are honoured to of won, to have a museum brave enough to trust and openly engage with the public via innovative software and devices (iPads) while taking on ideas based around the Internet of Things made all the difference.
 
QRator is a collaborative project between the UCL Centre for Digital Humanities (UCLDH), UCL Centre for Advanced Spatial Analysis (CASA), and UCL Museums and Collections, to develop new kinds of content, co-curated by the public, museum curators, and academic researchers, to enhance museum interpretation, community engagement and establish new connections to museum exhibit content. It is supported by the UCL Public Engagement Unit under the Beacons for Public Engagement programme – funded by the UK funding councils, Research Councils UK and the Wellcome Trust.
 
The project is powered by Tales of Things technology developed at UCL’s Centre for Advanced Spatial Analysis, which has created a method for cataloguing physical objects online which could make museums and galleries a more interactive experience. QRATOR takes the technology a step further bringing the opportunity to move the discussion of objects direct to the museum label and onto a digital collaborative interpretation label, users’ mobile phones, and online allowing the creation of a sustainable, world-leading model for two-way public interaction in museum spaces.
 
Notable thanks go to Steven Gray of CASA, Claire Ross of Digital Humanities, Jack Ashby and Mark Carnall of the Grant Museum of Zoology. With the support of Prof. Claire Warwick and Dr Melissa Terras of Digital Humanities and Sally MacDonald, Director of UCL Museums  it goes to show what can be achieved via cross disciplinary research and a drive to just go and do it. Thanks also goes to Susannah Chan from UCL Museums and Public Engagement for inventing the mounts for the iPads and Emma-Louise Nichols and Simon Jackson from the Grant Museum who moderate the content day in and day out.


Finally thanks to the UCL side of the TalesofThings team –  Dr Ralph Barthel and Dr Martin De Jode for working behind the scenes and putting the technology in place. TalesofThings is funded by the Digital Economy Research Councils UK.

 
Other museums shortlisted in the category were
Glasgow Life: Riverside Museum
Pin Point Visualisation Ltd: Exhibita Pro
The Public Catalogue Foundsation: Your Painting
Victoria and Albert Museum: Five Truths
 
You can find our more from http://www.qrator.org see also the post from UCL Museums on the award and a write up over at DigitalNerdosaurous.

ESRI CityEngine, Lumion, and SketchUp – The Ultimate City Toolkit?

By Featured, Featured Game Engine, Game Engines


Over the last few weeks we have been looking at ESRI’s CityEngine and how it can be used to create rapid urban scenes. As we noted it moves GIS visualisation a step forward while at the same time bringing procedural city modelling into the mainstream game engine world. Of course th
e heart of the CityEngine is the ability to import real world data but to get to grips with the interface it is sometimes easier to look at creating urban scenes from simple procedural rules.

As part of the MRes in Advanced in Spatial Analysis and Visualisation, here in CASA we have been looking at various techniques to visualise urban data. One such technique is the creation of a 3D exhibition space, allowing agent based models and urban data to be visualised within an architectural space.


Music by
Portoponte

The movie above combines the use of CityEngine in Lumion with SketchUp and 3DMax to insert an exhibition space into a city while burning the CASA logo into the street network. CityEngine is a notable step forward for ESRI, both in terms of visualisation and analysis, linking it with Lumion and SketchUp allows it to be taken even further, towards the ultimate city creation toolkit…

The London Data Table

By data visualization, London data, opendata, short throw projector

As regular readers will know we recently held a one day conference here at CASA entitled Smart Cities, Bridging the Physical and Digital. As part of the conference Steven Gray and George MacKerron built various exhibition pieces, including the  London Data Table. Created in the shape of Greater London, the table had various visualisations projected onto its surface; from live aircraft positions, live traffic and bike hire usage to movies of public transport over 24 hours. 


Steven, over on his Big Data Blog has written a write up on the logistics behind the build –  How big do we make the table? Can we find a projector with a short enough throw to project to the table? How were we going to mount the projector etc….

Citydashboard.org: A Live View of City Data

By City Dashboard, Project, Projects

Introducing Citydashboard.org: A Live View of City Data – here at the Centre for Advanced Spatial Analysis, University College London, we have just made live our latest in a series of services examining live data feeds – CityDashBoard. The system pulls in data from a variety feeds, developing our view that the next trend in OpenData is towards a live view of the city and live data feeds.


With the cities of Birmingham, Cardiff, Edinburgh,  Glasgow, Leeds, London, Manchester and Newcastle included, it is London with the largets amount of live feeds at the moment. As Duncan Geere noted in the write up of CityDashboard in Wired –  the dashboard for the city pulls in TfL data, RSS feeds from BBC London news, geographical information from OpenStreetMap, weather data from Google, trends from Twitter, traffic cameras and water levels along the Thames. It also includes data from UCL’s radiation detector.


Each section has a countdown to the next update with the weather from the Davis Vantage Pro 2 on the roof of CASA updating every 2 seconds, radiation every 5 seconds etc…


Based on a concept developed by Oliver O’Brien, Andrew Hudson-Smith and Richard Milton, here in CASA, the design and planning was developed by Duncan Smith and Oliver O’Brien with website development ultimately led by Oliver. Take a look at Olivers site for development details.

You can visit CityDashboard live at http://www.citydashboard.org/


The project is an output of NeISS, which is funded by JISC.
Close Menu

About Salient

The Castle
Unit 345
2500 Castle Dr
Manhattan, NY

T: +216 (0)40 3629 4753
E: hello@themenectar.com

Archives