A quick post with info on how the work of CASA (home of digital urban) has been used and featured in the media this week:
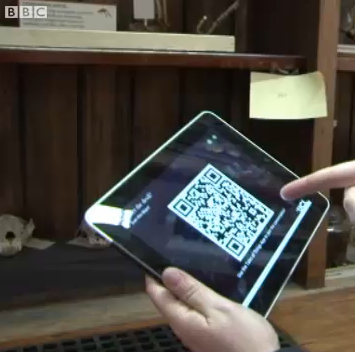
CNN USA and The Discovery Channel both made use of Tweet-o-Meter to demonstrate the use of social media after the earthquake in Japan, including an interview with Steven Gray:
Big Data is here, and it changes everything. From startups to the Fortune 500, smart companies are betting on data-driven insight. Strata, a conference organised by O’Reilly was based on three full days of hands-on training, information-rich sessions, and a sponsor pavilion filled with the key players and products. Aimed at bringing together the people, tools, and technologies to make data work the good news is that JISC has written comprehensive report for those who missed it.
The impact that freely available information has had on the learning community is truly profound, with tools like Wikipedia attracting huge audiences (over 365 million readers and growing). We can now access more data than ever – but what do we do with it all? If we want to take full advantage of all this information do we really have the tools we need? And how do we develop these tools in the future?
The internet exerts an unprecedented equalizing force in bringing access to information to everyone on the planet. More information is available (and mainly for free) now than ever before, and yet it is becoming clear that access to information is not enough. The infrastructure to store and share data within sectors is a vital part of the ecosystem, and yet it is often treated as an afterthought. We need a radical change in the way we develop infrastructure in the higher education sector, to ensure that services consumed and funded by the public can do their job as efficiently as possible and at the best possible price.
The research agenda of a university department is closely matched to the skills and goals of the professors and lecturers working in that department. The topics researched in the History department will depend on the specific knowledge and expertise of the History professors at that university. If an external company were to offer to plan their research agenda for them, it would be met with obvious cynicism. And yet the critical tools that these departments rely on are often dismissed as a secondary priority – despite the fact that those very tools define the limits of our ability to explore and learn from the data space that is the foundation of all research…..
Do regional boundaries defined by governments respect the more natural ways that people interact across space? We revisit this work in-light of a meeting in a few minutes time….
Coming out of CASA and the MIT Sensable City Lab, the movie below looks at a novel, fine-grained approach to regional delineation, based on analyzing networks of billions of individual human transactions:
Given a geographical area and some measure of the strength of links between its inhabitants, the team details how to partition the area into smaller, non-overlapping regions while minimizing the disruption to each person’s links. They tested the method on the largest non-Internet human network, inferred from a large telecommunications database in Great Britain. Our partitioning algorithm yields geographically cohesive regions that correspond remarkably well with administrative regions, while unveiling unexpected spatial structures that had previously only been hypothesized in the literature.
To be honest its worth heading over to the full paper and giving it a read… Carlo Ratti1, Stanislav Sobolevsky1, Francesco Calabrese1*,Clio Andris1, Jonathan Reades1,2, Mauro Martino1, Rob Claxton3, Steven H. Strogatz4
1 Senseable City Lab, Massachusetts Institute of Technology, Cambridge, Massachusetts, United States of America, 2 Centre for Advanced Spatial Analysis, University College London, London, United Kingdom, 3 BT Group, Ipswich, United Kingdom, 4 Department of Mathematics, Cornell University, Ithaca, New York, United States of America
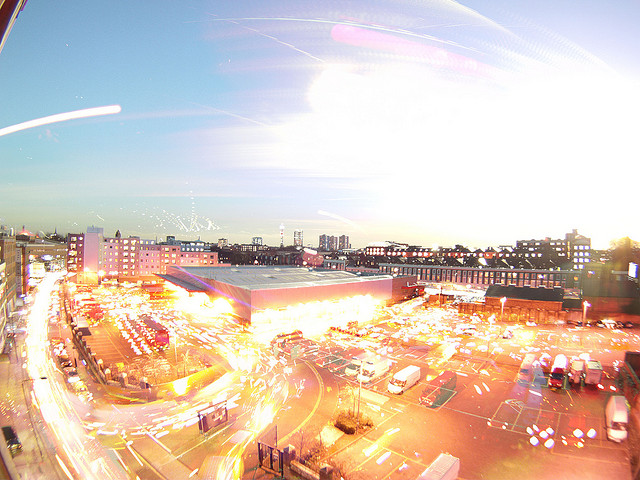
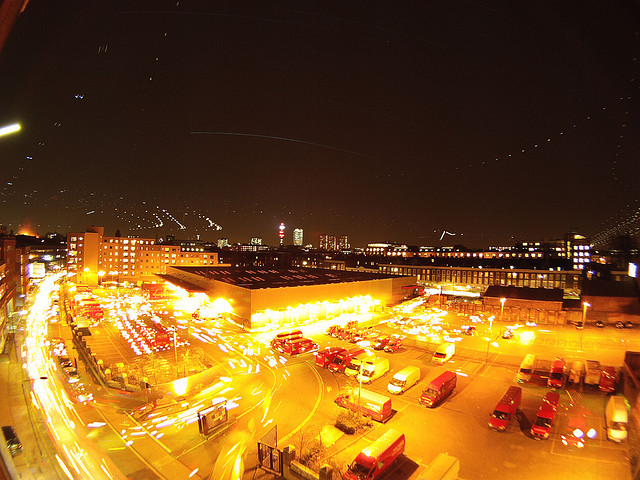
Mixing day and night images with the technique in astrophotography known as ‘star trails’ it is possible to capture a single image detailing both day and night activity. In the photograph below to the left is the moon streaking across the scene and the lights of aircraft at night, to the right is the sun with traffic captured below. Depending on your location the technique can create some interesting timelapse single views photographs, below we detail how to create your own.
Time Taken, 4 to 12 hours to capture, 2 to 6 hours to process.
The concept is simple, set up your camera, webcam or iphone at a suitable location, and capture an image at regular intervals, for our example we captured an image every 5 seconds pointing at the skyline of London. Capturing an image at least every 5 seconds is vital for star/aircraft trails as it allows for closer spacing between the lights in the final image.
We left the camera running for approximately 12 hours capturing 8000+ images, saved into a folder on our computer. Ours captured covered both day and night time, resulting in the following timelapse:
The next step is to open up photoshop, chose the images you want to use, and start stacking.
Image Stacking in Photoshop
The images will be stacked onto of an intially blank image via a simple automated action:
1) Create a new blank black image the same size are your captured photographs.
2) Load the action into the action windows in Photoshop and load the action Startrails.atn.
3) In Photoshop click ‘File’, ‘Automate’ and ‘Batch’. Select the action you have just loaded and choose your directory with the images as source and make sure you select ‘None’ for the output directory.
Click ‘Ok’ and leave it running, our Mac laptop took around an 2 hours to stack the images – resulting in the Star/Aircraft Trail’ below:
The line across the centre is a star and the bright line on the left is the moon coming into shot. The rest of the lights are aircraft in the sky above London. If you use a complete day/night sequence then you can create images of stars/activity in a blue sky, as in our first photograph.