The world of data is changing, vast amounts of free and open data are enabling innovative visualisations. Our new Bike-o-Meter could be seen as a case in point, it provides at a glance a view of how bicycle rental schemes in cities around the world are performing. It even allows you to view the percentage of hire bikes that would need to be redistributed to balance each scheme and here may lie the problem – it allows under performing cities to be clearly identified using their own data.
Sadly a number of cities, run by a common provider, have requested that we no longer use their data, stating use protection under the harmonised sui generis database right, as provided under Directive 96/9/EC: Chapter III Article 7 (1) and (2).
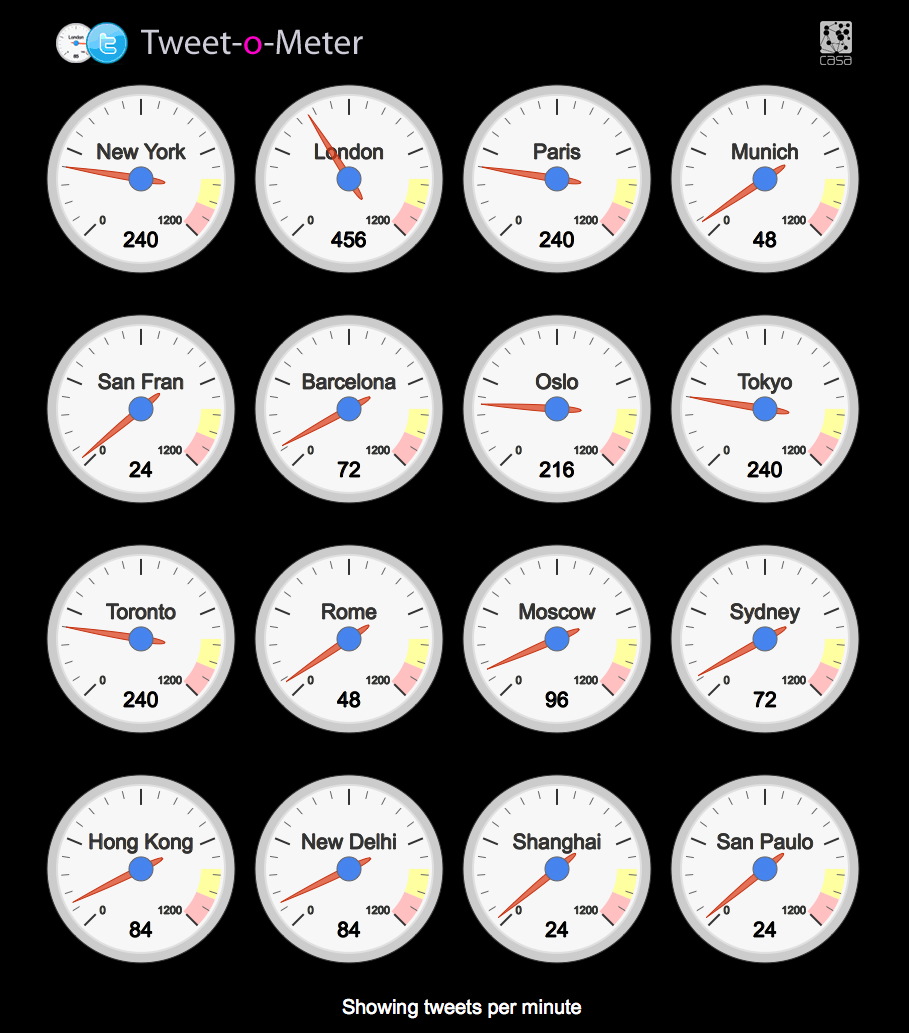
Below is how the Bike-o-Meter used to look:
We are of course happy to accept the request and as a result Paris/Dublin/Brussels/Valencia/Seville/ Vienna and Toyama are now sitting with empty dials. This is disappointing to say the least, we would be happy to add these cities back in but as ever with data its down to the providers…
Got a view? #bikeometer on Twitter.