
WikiLeaks Map: How Leaky is Your Country

By data mining, Data Visualisation, wikileaks, wikileaks map

WikiLeaks is a multi-jurisdictional public service designed to protect whistleblowers, journalists and activists who have sensitive materials to communicate to the public. Since July 2007, they have worked across the globe to obtain, publish and defend such materials, and, also, to fight in the legal and political spheres for the broader principles on which our work is based: the integrity of our common historical record and the rights of all peoples to create new history.

The question is which countries have the most leaks, what you need to ‘How Leaky is your Country’ by Ben Blundell here at CASA, University College London.

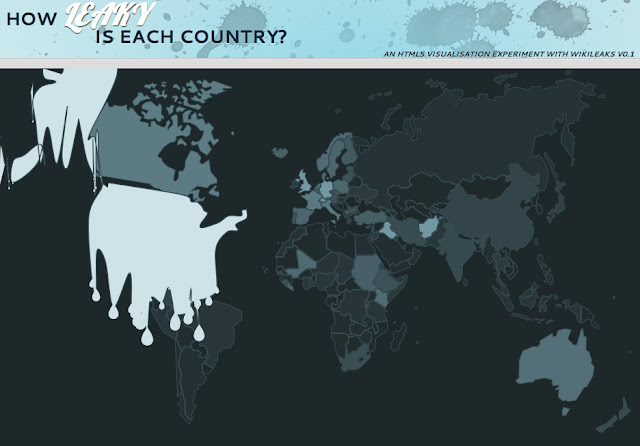
Written in HTML 5 the site trawls WikiLeaks daily and maps the outputs, it is well worth a look. Go to http://www.section9.co.uk/wikileaks for full info (it works best in Chrome).

A deeper analysis is forthcoming along with various new features, this is purely a first stage but an interesting one….

San Francisco Tweetography: Twitter Landscapes

By CASA, Cities Tweets, San Francisco, Tweet-o-Meter, tweetography, Twitter

Our geo-located twitter data mined from San Francisco has now been processed to create a new look at the city.

Processed by Fabian Neuhaus, a PhD student here at CASA, University College London, the new city twitter topography creates a unique new media landscape. The data is mined via our ‘Tweet-O-Meter’ system (soon to be seen in physical form in the British Library) which collects all geo-located tweets within a 30km radius of world cities.

You can view a full screen Google Maps style version of San Francisco over at Urban Tick as well as the previous maps of London, New York, Munich, Paris and Moscow.

A Minecraft Town in 30 Minutes

By Blog, Featured

Minecraft is a sandbox construction game involving players creating and destroying various types of blocks in a three dimensional environment. The player takes an avatar that can destroy or create blocks, forming fantastic structures, creations and artwork across the various multiplayer servers in multiple game modes.
As such it is a hotbed of virtual cities and towns which when stepped back from has notable potential for data visualisation, community planning and even public GIS. The movie below is a neat time-lapse detailing how to build a town in 30 minutes:
<iframe width=”640″ height=”360″ src=”http://www.youtube.com/embed/M_mRa9dL05A” frameborder=”0″ allowfullscreen></iframe>
 

Close Menu

About Salient

The Castle
Unit 345
2500 Castle Dr
Manhattan, NY

T: +216 (0)40 3629 4753
E: hello@themenectar.com

Archives