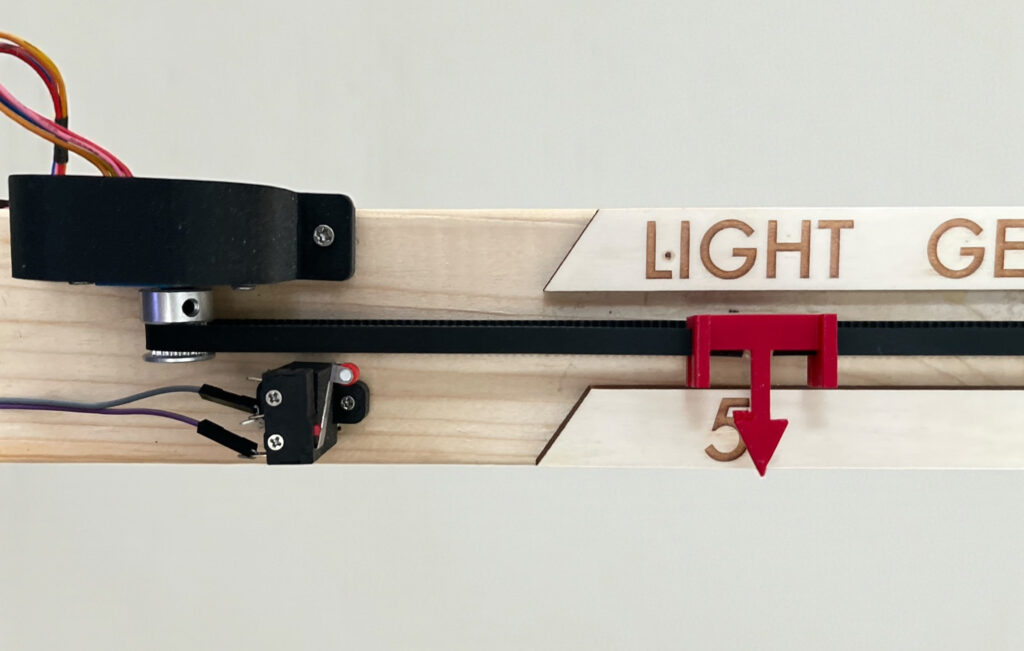

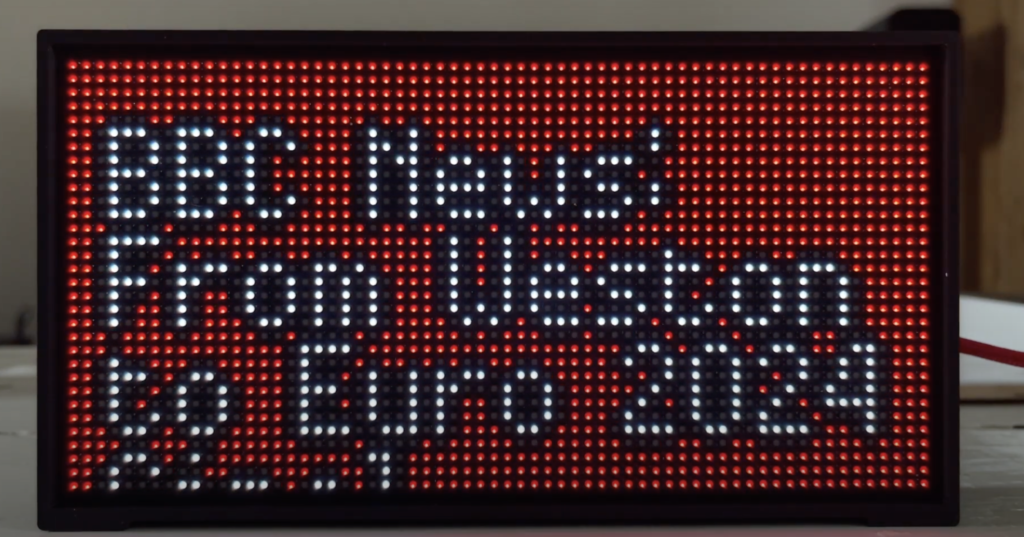
There are many tutorials online on using an LED Matrix to display data—many of them…
Andy9 April 2025

Developed at the Connected Environments Lab at The Centre for Advanced Spatial Analysis, University College London, the Open…
Andy14 June 2022
This article presents a practice-led investigation by a cross-disciplinary team of artists and computer scientists…
Andy13 June 2022

Urban Internet of Things (IoT) is in an early speculative phase. Often linked to the…
Andy13 June 2022

Following on from our Little Book of Connected Environments and the Internet of Things we…
Andy24 February 2021

At The Connected Environments Lab, part of The Bartlett Centre for Advanced Spatial Analysis, here…
Andy23 February 2021

Here at The Bartlett Centre for Advanced Spatial Analysis we run a simple dashboard view of the weather…
Andy2 February 2014