Artificial Intelligence is on everyone’s minds, and so is the human-induced environmental decline of our planet Earth.
Tellus Mater Installation
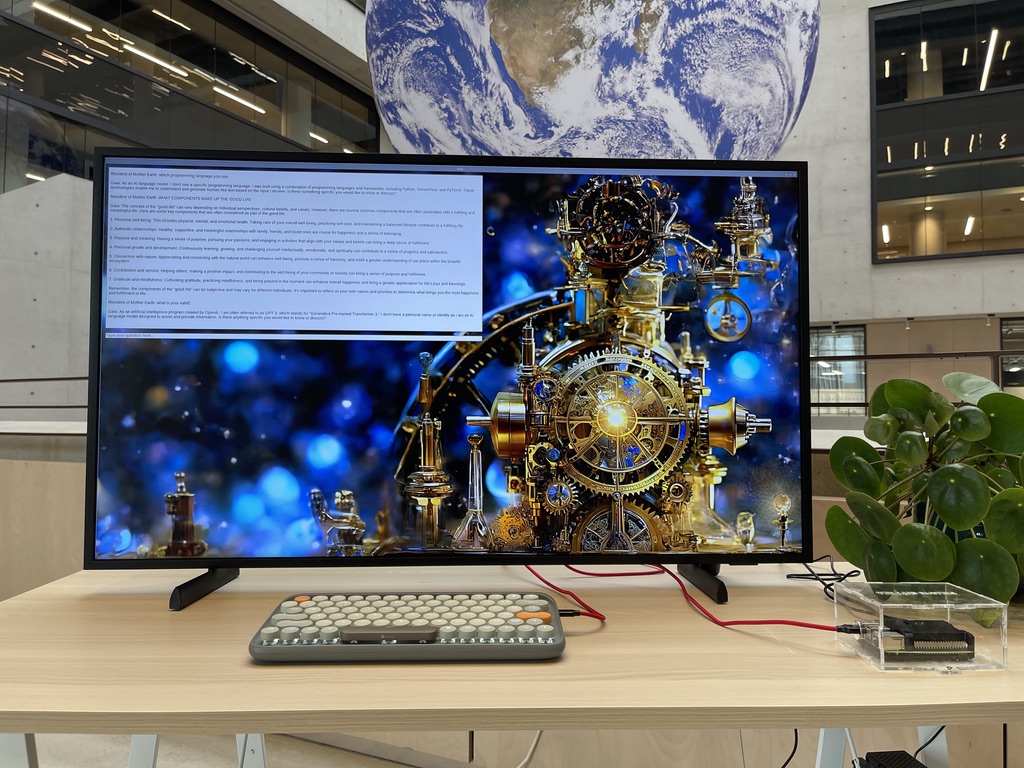
The Connected Environments team, as part of The Bartlett Centre for Advanced Spatial Analysis (CASA), invites you to come and consider both through a new interactive installation developed in response to Gaia, by Luke Jerram, featuring an AI interface that thinks it is the spirit of the Earth itself.
This installation extends the enduring concept of Mother Earth through recent developments in natural language processing and artificial intelligence, allowing you to talk to Mother Earth. Trained on over 300 billion words, Tellus Mater uses a large language model to converse and generate answers to questions about the planet, ecology and imagined futures based on data available up to September 2021.
Tellus Mater ChatGPT Interface
A new moving image work offers an artistic response to the AI language model. Integrating fragments of text generated through hours of conversational interaction with archival images of botanical gardens, the video loop (below) invites reflections on the generative potential and limitations of the technology as a form of collective expression and medium for dreaming up alternative future worlds.
All text input and answers are logged as part of an ongoing series of Internet of Things-related research projects developed in CASA into conversations with objects in our built and natural environment.
Tellus Mater has been in place for a month, and so far, it has produced 55, 944 words of conversation, equating to 106 pages of A4. Conversations have been wide and varied, ranging from asking Gaia what her favourite country is (she does not have a preference) through to the meaning of life (a deeply personal and individual quest – it may involve exploring one’s values, finding fulfilment in meaningful relationships and experiences, seeking knowledge and wisdom, or connecting with something greater than oneself) and onwards to why people dislike rain (its important to remember rain is essential for maintaining life on earth).
Created as an art installation, the movie runs alongside the interface, intercutting text generated through hours of conversation with Mother Earth and archival images of botanical gardens; the video loop explores different forms of world-making and imagining.
The work was created by Professor Andrew Hudson-Smith and Dr Leah Lovett of the Connected Environments Lab, UCL EAST, as part of The Bartlett Centre for Advanced Spatial Analysis and was kindly supported by the UCL East Engagement team. It will be on show at Marshgate until the end of the year.
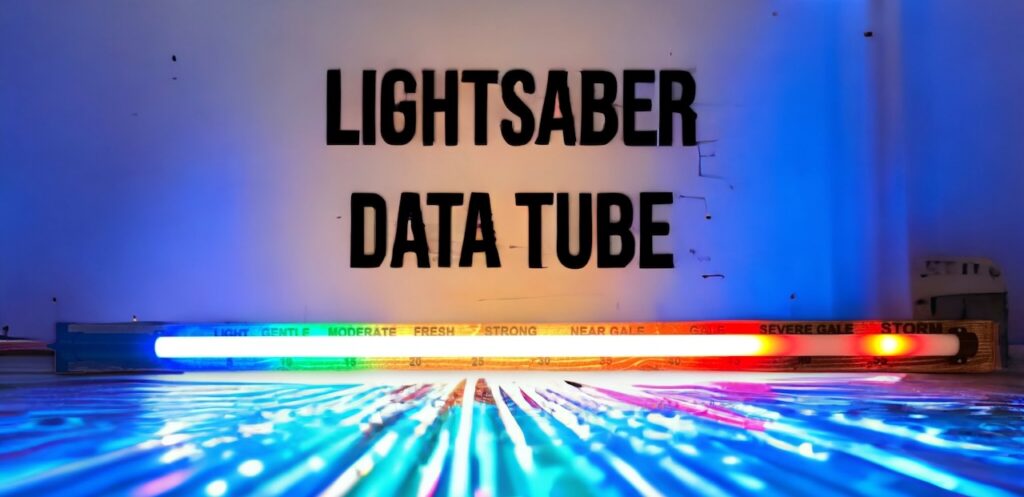
Imagine wielding the power of the Force, not to fight Sith Lords, but to display real-time data – in our case, wind speed, but the code/build can be adapted to any data feed. Using a NeoPixel strip inside a lightsaber tube, we can create a stunning visual representation of wind speeds. In this post, we’ll look at the build and dive into the code and the concept, helping you turn a lightsaber blade into a unique data meter. The build is part of the ongoing Open Gauges Project, which provides code and 3D print files to build several open-source data gauges.
Why a Lightsaber?
LightSaber Data Tube
Aside from it being just plain cool, the lightsaber’s blade offers a perfect medium for light diffusion. This means that each individual LED’s light on the NeoPixel strip spreads out, blending smoothly with its neighbours, ensuring that the entire saber glows uniformly. This makes it easier to visualise and read the data as the light is distributed evenly across the length of the lightsaber.
Whether you’re a Star Wars fan, a weather enthusiast, or just someone looking for a cool project, this NeoPixel Lightsaber wind meter offers a fun and educational experience. May the winds be with you!
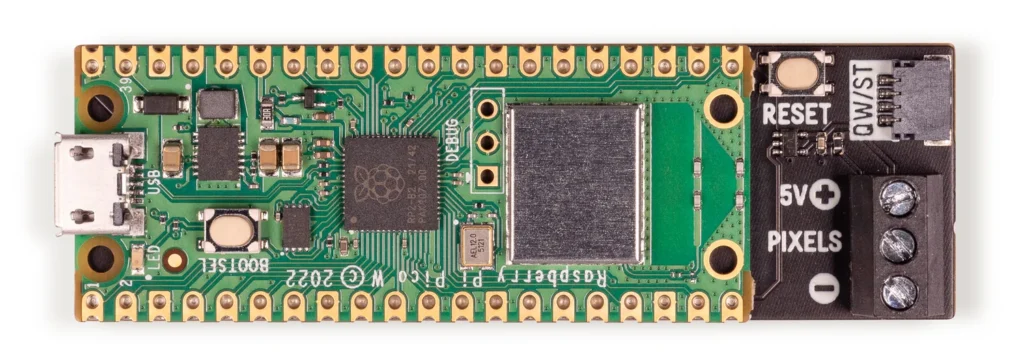
We put a standard 144 WS2812b Neopixels inside the foam tube in a one-metre strip. This is subsequently wrapped in the Blade Diffusion Film, which fits inside the Polycarbonate Tube. This is how most lightsabers are made; a strip of Neopixels inside a diffuser to make for smooth fluorescent-like lighting inside the tube. To power it, we use a Pi PicoW. Any Pi Pico will do, but Pimoroni makes one precisely for Neopixels, the Plasma Stick 2040W PicoW Aboard.
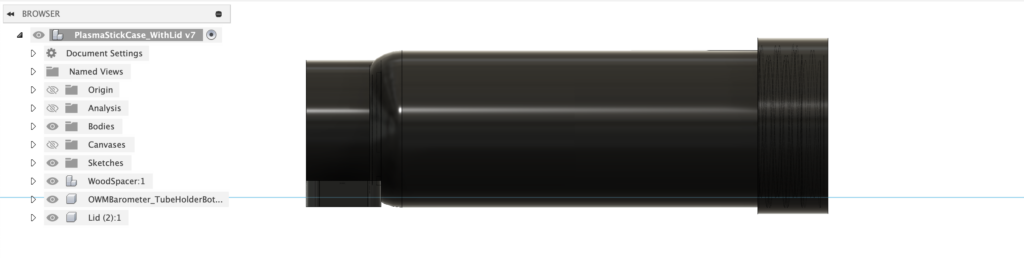
The lightsaber tube is mounted onto a 1.25-metre length of timber using a top and bottom end mount, which are 3D printed; all the 3D printed files are available in the GitHub Repository. The bottom part is a holder for both the Light Saber tube and the PicoW, with a screw on the bottom lid allowing easy access to the wiring.
Lightsaber Data Tube Holder – Fusion 360
The following YouTube clip from the Saber Armory provides an excellent guide to assembling the sabre. We use a flexible neopixel strip and, of course, different mounts, but the build is similar:
The NeoPixels
NeoPixels are individually addressable RGB LEDs. These are LEDs where you can control the colour and brightness of each individual light diode on the strip. With a long strip of these LEDs inside a lightsaber tube, we can represent wind speeds by lighting up different portions of the strip in varying colours.
How Do We Represent Wind Speed?
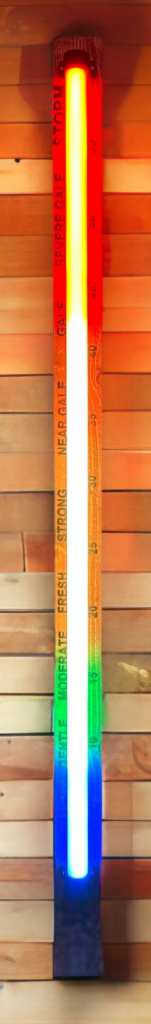
We divide the range of possible wind speeds into sections. In our code example, these sections are represented by colors:
0 to 10: BLUE (Low winds)
10 to 20: GREEN (Fresh winds)
20 to 30: YELLOW (Moderate winds)
30 to 40: ORANGE (Strong winds)
Above 40: RED (Above Gale Force)
As the wind speed increases, more of the strip lights up, moving through the colors as it progresses. Additionally, the highest wind speed measured is indicated with a RED pixel, serving as a max wind marker. This resets at midnight and provides an at-a-glance view of the maximum wind gust for the day.
Let’s Dive into the Code
All the files required are available in the GitHub Repository. We have aimed to make it as simple as possible to understand and edit. As such, we break down the code below. If you want to, you can simply copy across all the files from our GitHub to your PiPicoW, edit the config file for your wifi and our example should happily work. However, if you want to know more about the workings –
The heart of our project is the NeoPixel library and the MQTT protocol to receive wind speed data (we explore this in more depth below). We use MQTT as it allows real-time data to be effectively streamed to the Lightsaber blade. It also means the data can be swapped for other feeds as needs be, such as Air Pressure, Air Quality, Temperature etc – indeed any numerical data stream you can find. Our MQTT stream is provided by a Davis Vantage Pro 2 via Weewx on a Raspberry Pi which outputs the MQTT stream.
First, we set up the NeoPixel strip:
python
from neopixel import Neopixel

# Set up NeoPixels numpix = 144 pixels = Neopixel(numpix, 0, 15, "GRB") pixels.brightness(255)
We have 144 LEDs on our strip. We initialize it and set its brightness to maximum.
Next, we define our wind speed ranges and corresponding colors – this can be edited according to the wind speed range you want to use.
The update_pixels function is the heart of the color-mapping logic. It translates wind speed values into color changes on the NeoPixel strip:
A gentle breeze is shown in blue, indicative of calm weather.
As the wind picks up, the colors transition to green, a universal symbol of ‘go’ or safety.
When winds grow stronger, the color shifts to yellow, suggesting caution.
Higher wind speeds are shown in orange, and finally,
Potentially dangerous wind speeds are indicated with red, universally associated with warnings and danger.
This gradual change of colors not only represents the data but also provides an intuitive sense of the wind’s intensity.
Dynamic Updates
The script dynamically updates the NeoPixel colors as the wind speed changes. By using a threshold, minor fluctuations are filtered out preventing the display from changing too frequently and thus improving the readability of the data. Only significant changes in wind speed result in a color change, ensuring a clear and comprehensible visual output.
Tracking the Peak Wind Speed
The script utilizes global variables to keep track of the current maximum wind speed (max_wind) and the previous maximum (prev_max_wind). The function sub_cb updates these values as new wind speed messages are received via MQTT (we explore MQTT more in the next step):
if wind > max_wind:
    max_wind = int(wind)
This simple logic ensures that only the highest wind speed is showcased as the maximum.
Visualizing the Maximum Wind Speed
The maximum wind speed is visualized distinctly by coloring a specific NeoPixel in red. This is handled in the set_pixel_colour function:
This code assigns the ‘RED’ color from the colors dictionary to the pixel at the index corresponding to the maximum wind speed. This red marker provides an immediate visual indicator of the peak intensity of the wind speed for the current observation period.
Dynamic Updates and Resets
As the wind speed changes, the script continuously updates the display. If a new maximum is detected, it changes the appropriate pixel to red, and the previous maximum pixel reverts to its color that corresponds to its wind speed range. This dynamic updating gives real-time feedback about the wind’s behavior.
Furthermore, the script includes a scheduled reset at midnight:
if current_time[3] == 0 and current_time[4] == 0:  # Check if hour and minute are both 0
    machine.reset()
Understanding MQTT in Our NeoPixel Lightsaber
MQTT, which stands for Message Queuing Telemetry Transport, is a lightweight messaging protocol designed for low-bandwidth, high-latency, or unreliable networks. It’s become the de facto standard for IoT devices due to its simplicity and effectiveness. In our project, we use MQTT to receive wind speed data which then drives the NeoPixel display.
How MQTT Works
At a high level, MQTT operates over a publish/subscribe model:
Broker: A central server that receives messages from publishers (devices or applications that produce data) and routes them to subscribers (devices or applications that consume data). The broker manages active clients and topics.
Topic: Think of it as a “channel” where data is published. Clients can subscribe to topics or publish data to them.
Message: The data or information sent from the publisher to the subscriber.
Implementing MQTT in our Lightsaber
In our code, the MQTT protocol is implemented using the excellent mqtt_as library.
Setting up our MQTT client:
from mqtt_as import MQTTClient, config

# Define configuration
config['subs_cb'] = sub_cb
config['wifi_coro'] = wifi_han
config['connect_coro'] = conn_han
config['clean'] = True

# Set up client
MQTTClient.DEBUG = True
client = MQTTClient(config)
Subscribing to a topic – our topic provides wind speed data every 3 seconds. You can leave this topic in to test your system works, and then replace it with your own data, or any other data source.
We convert the received message into a number, which represents our wind speed. Depending on the wind speed value, the corresponding section of the NeoPixel strip is illuminated.
The main logic for setting the color of the pixels based on the wind speed is in the set_pixel_color function. This function checks if the wind speed has increased or decreased since the last measurement and updates the lightsaber’s glow accordingly.
The full code is below:
from neopixel import Neopixel
from mqtt_as import MQTTClient, config
from config import wifi_led, blue_led
import uasyncio as asyncio
import machine
import ntptime
import time

# Set up NeoPixels
numpix = 144
pixels = Neopixel(numpix, 0, 15, "GRB")

colors = {
    'BLUE': (0, 0, 255),
    'GREEN': (0, 255, 0),
    'YELLOW': (255, 100, 0),
    'ORANGE': (255, 50, 0),
    'RED': (255, 0, 0),
    'OFF': (0, 0, 0)
}

pixels.brightness(255)
prev_wind = 0
prev_max_wind = 0
max_wind = 0  # Initialize max_wind

WIND_SPEED_RANGE = [0, 60] #actual is half this amount to allow the max wind marker virtually
multiplier = numpix / (WIND_SPEED_RANGE[1] - WIND_SPEED_RANGE[0])

UPDATE_THRESHOLD = 2  # Only update if wind speed changes by 2 or more

def set_pixel_color(wind, max_wind):
    global prev_wind

    if abs(wind - prev_wind) < UPDATE_THRESHOLD:
        return

    while prev_wind < wind:
        update_pixels(prev_wind)
        time.sleep(0.05)
        prev_wind += 1

    while prev_wind > wind:
        update_pixels(prev_wind)
        time.sleep(0.05)
        prev_wind -= 1

    pixels[max_wind] = colors['RED']  # Update max_wind pixel

    pixels.show()


def update_pixels(wind_value):
    for i in range(1, numpix):
        if i <= wind_value < numpix:
            if i <= 20:
                color = colors['BLUE']
            elif i <= 40:
                color = colors['GREEN']
            elif i <= 80:
                color = colors['YELLOW']
            elif i <= 100:
                color = colors['ORANGE']
            else:
                color = colors['RED']
            pixels[i] = color
        elif i == max_wind:  # Use max_wind directly
            pixels[i] = colors['RED']
        else:
            pixels[i] = colors['OFF']
    pixels.show()

def sub_cb(topic, msg, retained):
    global max_wind, prev_max_wind

    print(f'Topic: "{topic.decode()}" Message: "{msg.decode()}" Retained: {retained}')
    wind_speed = int(msg)

    if WIND_SPEED_RANGE[0] <= wind_speed <= WIND_SPEED_RANGE[1]:
        wind = (wind_speed - WIND_SPEED_RANGE[0]) * multiplier

        if wind > max_wind:
            max_wind = int(wind)

        if max_wind != prev_max_wind:  # Check if max_wind has changed
            print("Max Wind", max_wind)
            prev_max_wind = max_wind

        set_pixel_color(wind, max_wind)
    else:
        for i in range(numpix):
            pixels[i] = colors['OFF']
        pixels.show()


async def get_current_minute():
    try:
        ntptime.settime()
        current_time = time.localtime()
        return current_time[4]
    except:
        print("Could not get the time from the internet")
        return None

#Reset Wind Max and System at Midnight
async def reset_on_hour():
    while True:
        try:
            ntptime.settime()  # Get the current time from the internet
            current_time = time.localtime()
            if current_time[3] == 0 and current_time[4] == 0:  # Check if hour and minute are both 0
                machine.reset()
            else:
                await asyncio.sleep(60 - current_time[5])
        except:
            print("Could not get the time from the internet")
            await asyncio.sleep(60)  # Retry after 1 minute if time sync fails


async def heartbeat():
    s = True
    while True:
        await asyncio.sleep_ms(500)
        blue_led(s)
        s = not s

async def wifi_han(state):
    wifi_led(not state)
    print('Wifi is ', 'up' if state else 'down')
    await asyncio.sleep(1)
    if state:
        asyncio.create_task(reset_on_hour())  # Start reset_on_hour task after WiFi is connected

async def conn_han(client):
     # await client.subscribe('personal/ucfnaps/saber/config/', 1)
       await client.subscribe('personal/ucfnaps/downhamweather/windSpeed_mph', 1)

async def main(client):
    try:
        await client.connect()  # Ensure WiFi and MQTT connection before starting other tasks
    except OSError:
        print('Connection failed.')
        return

    n = 0
    while True:
        await asyncio.sleep(5)
        n += 1

# Define configuration
config['subs_cb'] = sub_cb
config['wifi_coro'] = wifi_han
config['connect_coro'] = conn_han
config['clean'] = True

# Set up client
MQTTClient.DEBUG = True
client = MQTTClient(config)

asyncio.create_task(heartbeat())

try:
    asyncio.run(main(client))
finally:
    client.close()
    asyncio.new_event_loop()
Bringing it All Together
We also provide two wall mounts which screw onto the back of the backing wood. This provides spacing so the Lightsaber Wind Gauge has a space off the wall as well as a hook for a standard nail or screw. The wood was dyed with Dark Oak wood stain and the wind speed indicators (text and numbers) were glued at the corresponding lengths along the lightsaber blade.
LightSaber Data Tube – Fusion360
To effectively space the numbers/text we changed the MQTT feed away from the realtime feed to a feed we can send data to (/saber/config). This allowed us to send the value from 5 to 60 and light up the tube, allowing us to visually see where the text/numbers are glued.
That completes the build, with the combination of the NeoPixel strip, MQTT for data transmission, and the aesthetic appeal of a lightsaber. We hope you agree that it makes for a unique and visually pleasing method to measure and display wind speed.
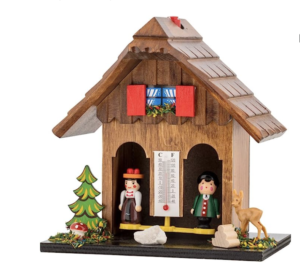
Traditional German weather houses are small, decorative structures that are popular in Germany and other parts of Europe. They are often made from wood and used to predict the weather.
The way the weather house works is quite simple. Inside the house, there is a strip of catgut or hair. The gut relaxes or shrinks based on the humidity in the surrounding air, relaxing when the air is wet and tensing when the air is dry. Attached to the strip is a small figure of a man and a woman. When the humidity in the air changes, the strip will expand or contract, causing the figures to move.
If the weather is going to be dry and sunny, the man will come out of the house. If it is going to be wet and rainy, the woman will come out of the house. If the humidity is just right, both the man and the woman will be visible.
Traditional German weather houses are, an interesting, if slightly imprecise way to predict the weather. They are also a useful inspiration to develop a slightly more modern version using the Open Weather Map API, a 360-degree non-continuous servo, some neopixels and a Raspberry Pi Pico W.
The Weather House Reimagined
In essence the house is a series of weather symbols which rotate according to the feed from the Open Weather Map API. This can be set to any location in the world and it updates every 15 minutes. It is also adaptable to change to your own source of weather data, perhaps your own personal weather station.
Weather House Components
There are also two sets of neopixels – one to light up the symbol, this works well at night and looks like an outside light on the house, allowing the weather conditions to be seen. The other is an 8 pixel neopixel strip which changes colour and animates according to the conditions. If it’s raining then the lights change to blue and simulate raindrops, for sunny spells they light and dim with tinges of yellow to simulate the sun poking out of the clouds, etc. All of these are editable in the code to change according to your own preference.
Weather House Neopixels
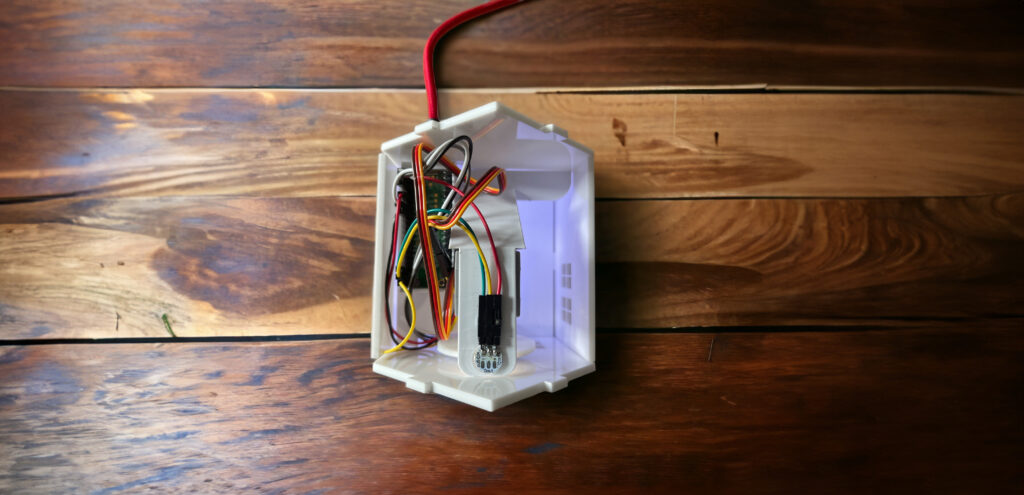
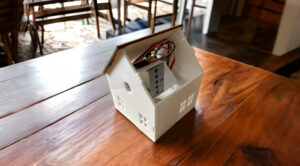
At the heart of the weather house is a Raspberry Pi Pico W, held in a 3D printed enclosure which also encases the LEDs and the Servo.
Weather House Laser Cut Outs
It slots into the case which, in our example, is laser cut from white perspex for the house and 3mm plywood for the roof.
Weather House Laser Cut Outs
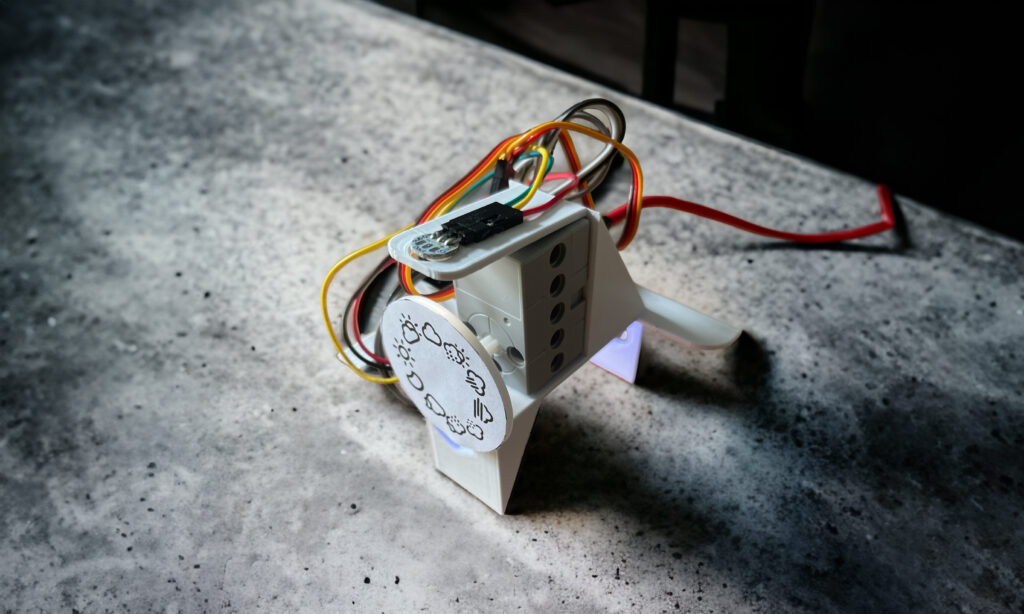
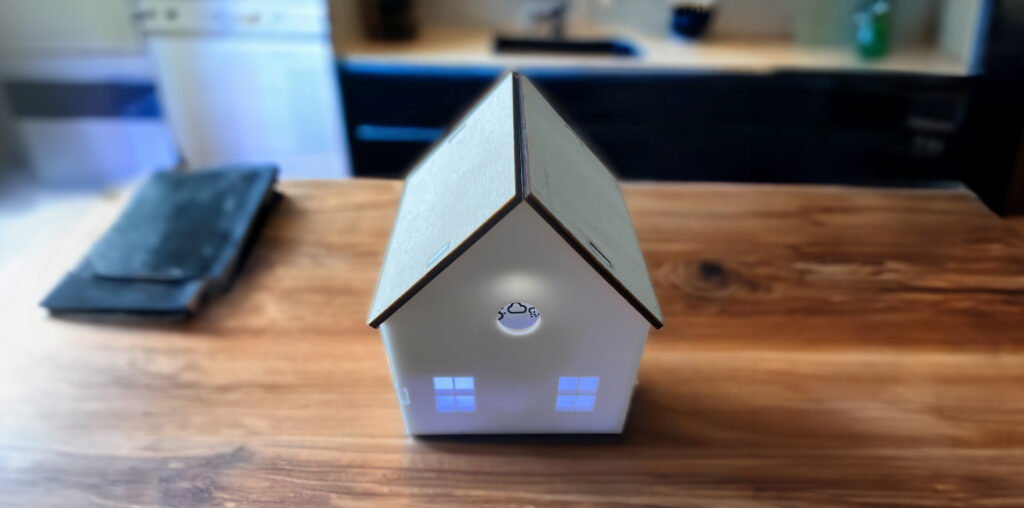
Once assembled the 3D printed enclosure along with the dial, fits into the main house. The servo is set to its starting point with the ‘Sun’ icon showing through the window.
Weather House Inside View
We power ours from a 20,000mAh power bank which keeps it running for about a week. Each time the data updates the outside lamp turns on and off, so you have a visual clue that new data has uploaded.
The Final Built Weather House
The Micropython code, build components, 3D print and laser cut files are available on our accompanying GitHub page, note the project is still a work in progress..
Back in 2013, I wrote a blog post on 500 Words a Day, Academic Writing. Noting that its not something many academics admit – but writing is hard, not for all, there are some academics who simply flow words but for many its a challenge. There is nothing worse than the blank page of a Word/LaTeX document, knowing you have 10,000 words to go and only a title or abstract in place. It also depends on your stage in an academic career. Researchers generally have more time during the day to, as the job title suggests, to research and therefore write, lecturers less time (increasingly so) and so on. That said, the ability to do anything else than write the paper/masters thesis/PhD chapter is strong, many academics are excellent in justifying just one more bit of research before they start writing.
If you go through a period of not writing, be it weeks or months, then the guilt as an academic starts to build up, we are meant to write papers as those around will often be only too keen to chip in during conversations. I see it across the board, from professors through to starting out researchers and students leaving the course essay until the last possible minute. There is a need to not only get over the fear of starting a new paper but to also form a pattern to take away the worry that can all too easily build up.
I stated that “It turns out the answer is easy, and thanks go to Sir Alan Wilson of CASA who i found sitting typing early one morning, turns out he always aims for: Write 500 words a day”.
I was wrong, its not easy at all, but i found out how to solve it.
Jump forward to 2023, I am mid book writing with 23,000 words now in place over the last 8 weeks, and most suprising to me, I’ve enjoyed it. The dread of the blank page of A4 has gone and i think i’ve finally learnt how to break the fear, the writers block and not only get it done but to actually miss it if i have a day when i cant write.
There are many books out there that will, over the course of 30,000 words or so, generally tell you the same thing on how to be productive, how to write academically, how to write your first novel etc. In essense it comes down to two simple points and if you can follow these you will, within two weeks, get into a pattern which might just change the way you write and with it your output and perhaps even your path in life:
1) ) Use the Pomodoro Technique – The “Pomodoro Technique” is a time management method developed by Francesco Cirillo in the late 1980s. The name comes from the Italian word “pomodoro” (tomato) because Cirillo used a tomato-shaped kitchen timer when he first implemented the method. The technique is designed to improve productivity and focus by breaking work into intervals, traditionally 25 minutes long, separated by short breaks.
Here’s how you can implement it:
Decide on what you are going to write today – for example, my task today was 500 words on ‘Avatars in a Future Metaverse’ (its a working title for a section of the book.
Use a timer (it doesn’t have to be tomato-shaped – although i use the excellent extension for Chrome – which is Tomato shaped, and free – Marinara: Pomodoro® Assistant) to set a 25-minute countdown. This 25-minute work period is known as one “pomodoro.”
Start researching, writing, in short work on the task in hand. Focus on the task for the entire 25 minutes. If a distraction pops into your head, write it down on a piece of paper and get back to the writing.
When the timer goes off after 25 minutes, stop working. Marinara in Chrome can be set to make a pleasant ‘chiming sound’, marking the end of 25 minutes.
Take a Short Break Relax for a 5-minute break. Stretch, walk around, or do something you enjoy for a few minutes, tbh i normally use the 5 minutes to check my open tabs in Chrome – Twitter (i cant call it ‘X’ yet) etc.
Repeat – the technique statrs that after four pomodoros (i.e., after completing four 25-minute work sessions and taking three 5-minute breaks) you then take a longer break, around 15-30 minutes. This longer break allows you to relax and recharge before diving into another set of pomodoros. To be honest i often do it after 3 sessions as thats the point where my brain is beginning to drift. If all has gone well however i may well be nearing the 500 words at this point, some days the 500 words are easily won, some days much less so. If its proving more challenging then i repeat the process until done.
The primary benefits of the Pomodoro Technique i have found are:
An Enhanced Focus: By dedicating short periods to a single task, it becomes easier to stay engaged and focused. Its amazing how rare a focused 25 minutes actually is without using the technique.
Regular Breaks: These prevent burnout and keep your mind fresh, they are also often enough not to allow sneaking checking of Chrome tabs.
Tracking Productivity: By counting pomodoros, you can gauge how much effort tasks require and better estimate future tasks. This also goes for word count, if you track your word count as you go, I have a running total i update each day on Slack, then it does start to take the pressure off.
You can adjust the timings to suit your needs. Some people prefer longer or shorter work intervals, but the key is to maintain a consistent pattern of focused work followed by a break.
2) Get into a Pattern – a Habit of Writing. The Pomodoro Technique will automatically do that, a habit is often portrayed as a bad thing but it can also be good and it trains your brain to be ready to write at a set time. Personally i use 9.30am to 12.30pm, so a three hour slot each day. This is a time i would often have meetings, so i have blocked out the diary going forward and have moved meetings to the afternoon. At that point my writing is done and im not distracted by an article i should be writing.
Writing 500 words a day gives you 2,500 a week – 10,000 a month which is easily a PhD chapter, two working papers, one journal paper or a 1/4 of a short novel.
It may seem obvious, but it is all too easy to complete a long day with it filled with meetings – often meetings you have put in the diary youself and ending up at the end of the day without having any words on paper.
I’ve been doing it for just over two months and have 22, 652 words written, if you are reading this then do try the technique and let us know in the comments how you get on.
The book? – The working title is: Cities in the Metaverse: Digital Twins, Spatial Computing, Society, Avatars and Economics on the New Frontier with Dr Valerio Signorelli,and Professor Duncan Wilson of CASA.
This blog post? – 1,991 words, or three Pomodoros….
About Salient
Lorem ipsum dolor sit amet, consectetur elit porta. Vestibulum ante justo, volutpat quis porta non, vulputate id diam. Lorem et ipsum dolor sit amet, consectetur adipiscing elit. Morbi vitae sem in massa sagittis.