ArtBlogEngagementMaking Tellus Mater: An AI That Thinks it’s Mother Earth Artificial Intelligence is on everyone’s minds, and so is the human-induced environmental decline of our…admin17 December 2023
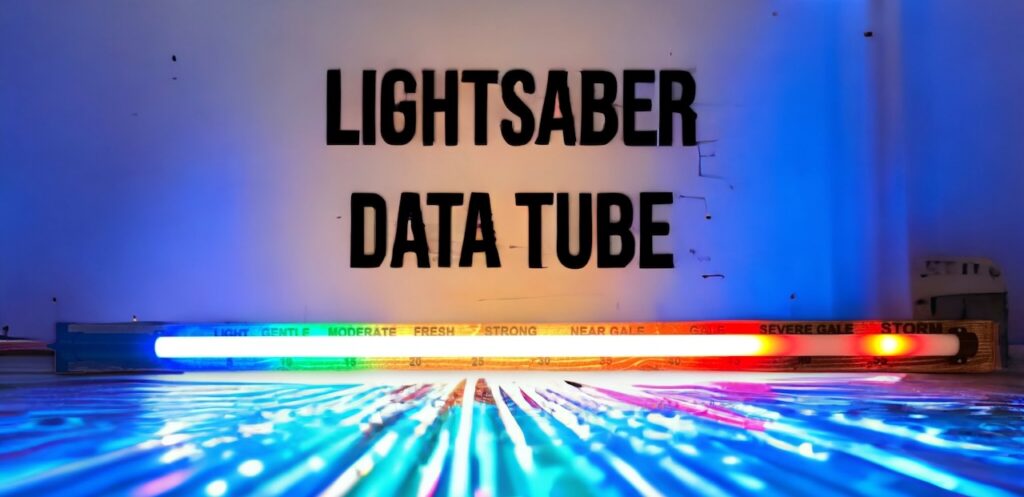
MakingOpen Gauges How to Make a Lightsaber Realtime Wind Speed Gauge Imagine wielding the power of the Force, not to fight Sith Lords, but to display…admin9 November 2023
MakingWeather Reimaging the Traditional Weather House with Open Data, Laser Cutting and 3D Printing Traditional German weather houses are small, decorative structures that are popular in Germany and other…admin18 August 2023
Writing Writing 500 Words a Day – The Pomodoro Technique Back in 2013, I wrote a blog post on 500 Words a Day, Academic Writing.…admin10 August 2023
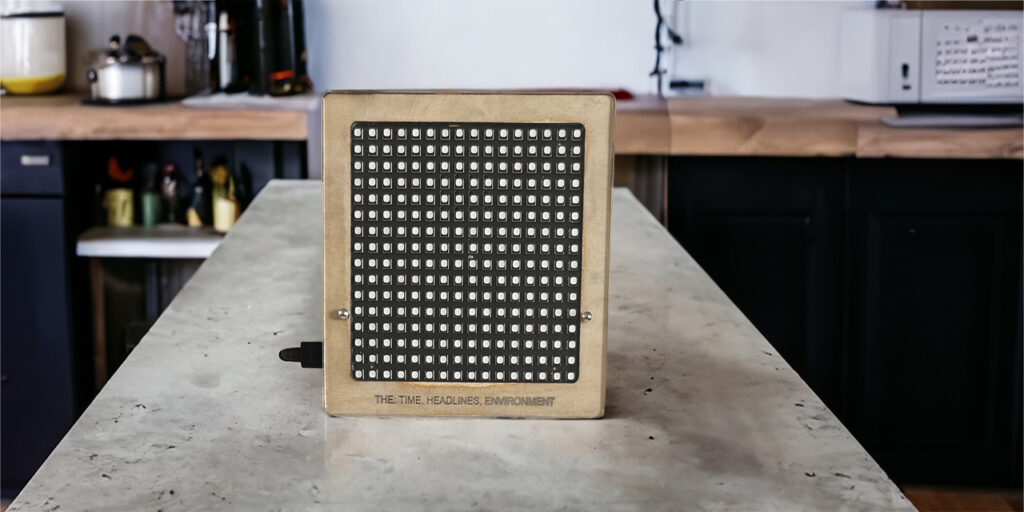
Making MQTT Scroller for the Pimoroni Stellar Unicorn: THE: Time, Headlines and Environmental Information Pimoroni make a range of LED matrix displays with Pi Pico W's built in -…admin3 August 2023
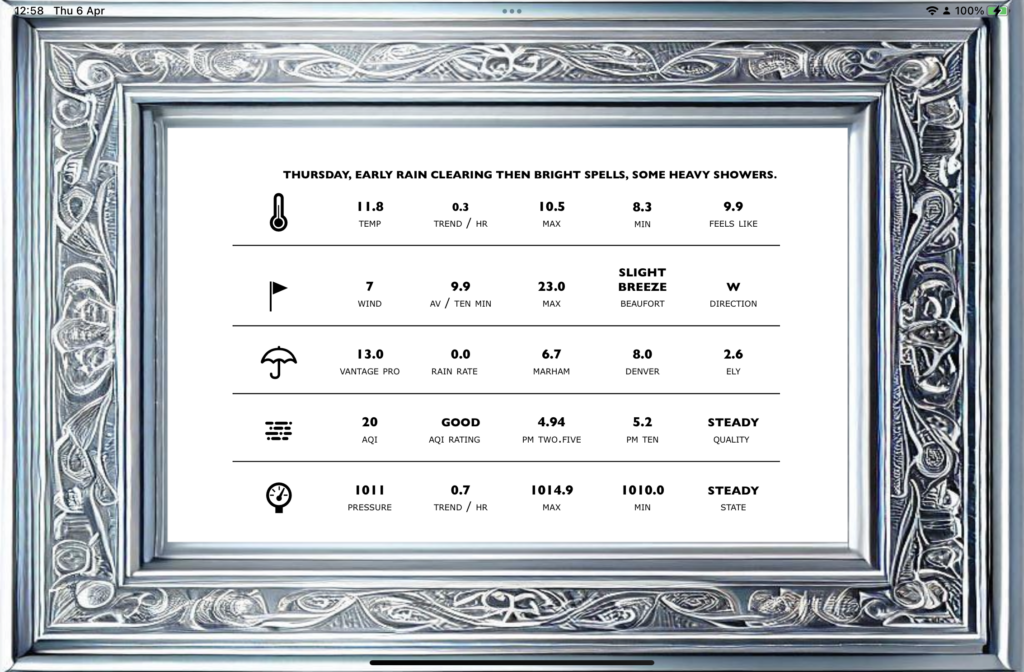
AI Made by AI: The Making of Frame-IT Every app has a story, from the idea through to story boarding, finding a design…admin7 April 2023
Apps Frame-IT "Frame-IT is the perfect app for anyone who loves to display websites in style. With…admin7 April 2023
Data VisualisationGithubPhysical Data Devices Open Gauges – Physical and Digital Data Display Devices Developed at the Connected Environments Lab at The Centre for Advanced Spatial Analysis, University College London, the Open…admin14 June 2022
30 Days in ActiveWorldsMetaverseMirror WorldsSecond Life Incoming Metaverses: Digital Mirrors for Urban Planning The planning process has been, arguably, slow to adapt and adopt new technologies: It is…admin13 June 2022
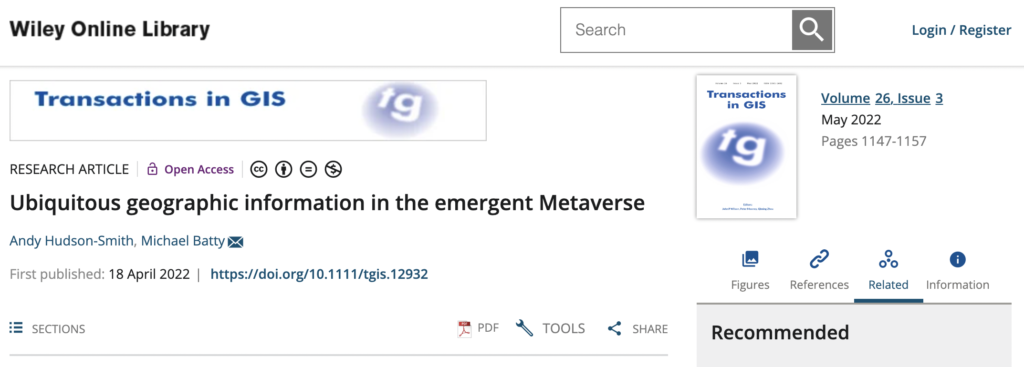
Metaversepapers Ubiquitous geographic information in the emergent Metaverse Another new paper - this time with Michael Batty - We sketch a brief history…admin13 June 2022