We don’t have much information on this one but its really nice. Sometimes thats the best way, finding neat clips that only have a few views (32 in this case) and giving them a showcase. We have added a ‘retweet’ button to the top right of our posts as a test, the movie below deserves a wider viewing:
The latter half of the 20th century saw the built environment merged with media space, and architecture taking on new roles related to branding, image and consumerism. Augmented reality may recontextualise the functions of consumerism and architecture, and change in the way in which we operate within it:
The clip above was produced by Keiichi Matsuda a final year Masters in Architecture over at The Bartlett, here at University College London, as part of a larger project about the social and architectural consequences of new media and augmented reality.
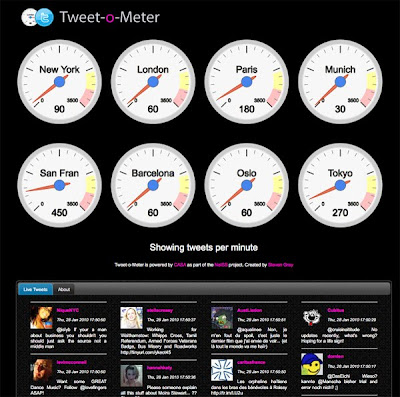
Due to various emails asking ‘where is xxx’ we have added four more cities to the Tweet-o-Meter which means more data to collect and analyse. Is it true that, New York is the city that never sleeps? Do Londoners send more Tweets than New Yorkians’? Is Oslo a bigger Tweeter than Munich? Is Tokyo into Tweets as much as Barcelona? Has San Francisco calmed down after that Apple Event?
The Tweet-o-Meter measures the amount of tweets (measured in Tweets per Minute or TPM) received from various locations around the world. The gauges are updated every second giving you a live view of the TPM’s in each location.
Tweet-o-Meter is designed to mine data for later analysis relating to furthering our understanding of social and temporal dynamics for e-Social Science within the Twitter demographic. The system is under development here at CASA as part of a wider survey tool as part of the NeISS project in association with Urban Tick and coded by Steven Gray.
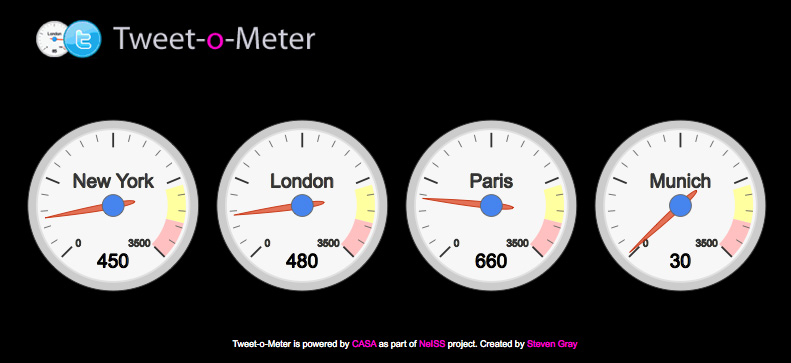
‘New York, London, Paris, Munich everybody talk about Pop Musik’ – that was 1979 and the catch line by the group M. As such we thought it would be interesting to mine what people are talking about in 2010.
We are planning to log all geolocated Tweets in NewYork, London, Paris and Munich over a 24 hour period via the Twitter API as part of research under the NeISS project in association with UrbanTick and ourselves here at Digital Urban, part of CASA, University College London.
The system is running in beta mode over the next week with visualisation of the Tweets per Minute provided via our Tweet-o-Meter. While the reference to the 1979 is all well and good the system is actually designed to mine data for later analysis relating to further our understanding of the social and temporal dynamics of cities within the Twitter demographic. These can be mapped allowing us to capture 24 hours in the life of the city.
Below is an example of the type of base output we expect, as we are also extracting the social data and retweets we can map this in both time and space. UrbanTick has a nice tutorial on how to the do the timelapse of Tweets below:
Currently in beta mode the Tweet-o-Meter updates every 10 seconds displaying the city with the highest number of Tweets, the logged 24 hour period will be announced next week. Once collected we will be able to create city maps detailing the Tweet activity over time and space, a wider ranging system will be launched as part of a free data collection service via NeISS in the next couple of months.
See http://www.casa.ucl.ac.uk/tom/ to view New York, London, Paris, Munich via Tweet-o-Meter and if your in one of those cities and want to take part, simply make sure you have geolocation turned on in your Twitter preferences.
For those too young or perhaps simply nostalgic for the late 70’s/early 80’s hit that inspired the work, here is PopMusik via YouTube (its great…).