VistorVille is a city based visualisation program for your webstats, each building represents a web page; each bus a search engine; and each animated character a visitor to the site:
Setup is as easy as pasting in a tracking code, we would try it out but the combination of cities and stats is probably a step too far if we want to get any work done this week…
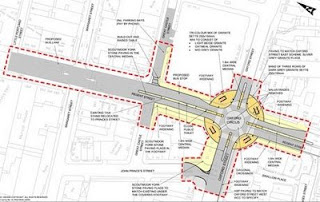
Oxford Circus in London is a busy intersection between Regent Street and Oxford Street with more than 200m visitors a year (BBC). Work is about to begin on a £5m project to pedestrianise part of Oxford Circus. Based on crossings in Tokyo, the new design will stop all traffic in all directions, and allow people to cross diagonally as well as straight ahead. Street clutter and barriers at the junction of Oxford Street and Regent Street will also be removed.
Graphic showing the Oxford Circus redesign
The movie below created by Designhive details how Atkins’ two-dimensional traffic and pedestrian models can be coupled with 3D Studio Max in such a way it is difficult to distinguish the model from a real piece of video footage. Combining the models in the simulation in this way makes the finished product particularly compelling. Furthermore it has the benefit of being based on the technical models developed to test the proposals prior to their implementation (such as the removal of street clutter).
The pedestrian model is a particle-based system controlling 5000 agents to match up the data produced by Atkins Intelligent Space. When the final simulation was rendered, the ‘particles’ were replaced with animated people, programmed to walk while the points were moving and idle when the points stopped for traffic lights.
Social Explorer provides easy access to demographic information about the United States, from 1790 to present. Their online tools are aimed to help you visually analyse and understand the demography of the United States through the use of interactive maps and data reports. The free collection on the website features historical census data maps and reports. This includes a limited subset of socio-economic and demographic data on the United States from 1790 to 2007. Subscribers have access to over 12,000 maps between 1790 and 2007, and over 50,000 variables of data in reports.
Communicating and portraying geographical data is not an easy task, as to be honest it can all come across as a bit dull. That said, the video below provides and insight into Social Explorer:
Still awake? Its not the most gripping of videos but the tool is actually well worth a look – head over to http://www.socialexplorer.com/ to give it a try.
The image above by Visibuild, a host and solutions provider for the AEC industries, is running in realXtend, currently in early phase alpha, it is a platform to watch. The main attraction for us here at digital urban of realXtend is the ability to import models via Revit, ArchiCAD, SketchUp, 3DMax etc, something that Second Life still lacks in any quick and easy form.
The technology demo below provides an insight into the possibilities:
With a notable rendering quality, combined with the dynamic shade and shadows, realXtend creates an interesting and comparably low-cost way to experience an architectural design.
If you are at all interested in Virtual Architecture we recommend a trip over to The Arch Network, set up by Jon Brouchoud it focuses on the communication of architecture via Virtual Worlds. We will be taking a closer look at realXtend while our development using Unity is put on hold (our Mac was stolen).
The Unity work will return as soon we get a replacement laptop sorted and our files restored via Time Machine.
See The Arch Network for more details on SketchUp models running in realXtend.