GPS tracks can show the ‘life’ of a city, which parts of the city are working, areas that are no go zones and sections dedicated to shopping, work, entertainment etc. The possibilities for using GPS data to examine our cities ‘health’ are intriguing which turns us to the work by Fabian over at http://urbantick.blogspot.com/
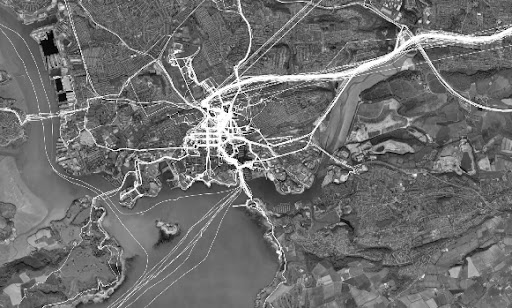
The movie below illustrates Fabian’s paths around the city of Plymouth over 365 days, compressed and visualised in Google Earth:
plymouth365_24H_duration from urbanTick on Vimeo.
Google Earth is an excellent tool for displaying GPS data, especially over time, we are just starting to look into other options, perhaps After Effects – any thoughts or ideas for visualising GPS tracks over time would be great…
See http://urbantick.blogspot.com/ for more movies and examples on visualising GPS tracks in the city.
