The housing market is a constant topic of conversation in the UK. Prices are currently at an all time high with talk of an unsustainable market, the graph below from housepricecrash.co.uk illustrates the current growth and the dip in prices as a result of the crash in the mid 1990’s:
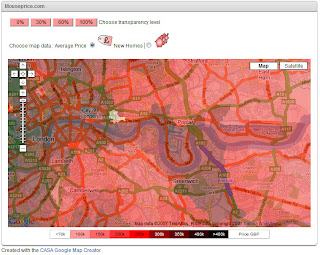
 Why are we talking about house prices on Digital Urban? The following map illustrating house price data from the Land Registry has just been released by mouseprice.com and its been created using our labs Google Map Creator:
 The data is mapped UK wide and with the help of our Google Map Creator you can zoom down to local regions. Of note in the image above is the way house prices follow the Thames, and people wonder why at 30 something i don’t own a house, take a look at the London region and your see why….. jobs offers outside of London (or better paid in London) are welcome!
View the House Price Map
Find out more and download Google Map Creator