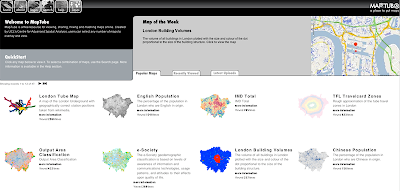
CASA is pleased to announce the beta release of MapTube London – http://www.maptube.org/london. The site provides a quick and easy way to visually compare various datasets about the city. Working in a similar vein to our main MapTube site the London version focuses data on the local area, making it easy for interested users, councilors, politicians to quickly and easily view and compare maps.
Software is provided free of charge for those holding data on the city to quickly and easily convert to the Google Maps format, ready for inclusion on MapTube London. The London Boroughs and the Greater London Authority hold vasts amounts of data, now there is a quick way for them to share and more importantly visually compare data city wide.
 To overlay any number of maps simply click the ‘Search’ button and then the ‘Plus’ icon next to each set of visual data. Once selected click ‘View Map’ and then you can fade in/out and change layers to visually compare.

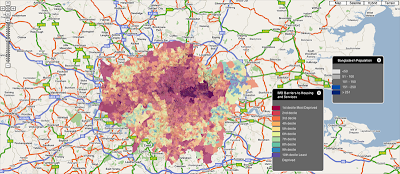
Pictured above is a prime example, selecting the map for ‘Bangladesh Population’ and ‘Barriers to Housing and Services’ illustrates that the majority of Bangladesh’s in London live in areas where access to both housing and services is limited.
At present we have 47 maps on the site covering issues such as Crime, Population, Ethnic Clustering and Building Volume, amongst other, as boroughs, councils and authorities get involved we hope this number will rise.
As a beta site we are making additions over the next few weeks, for example the ability to overlay KML will appear on the next few days allowing Google’s MyMaps to be combined with MapTube London – the site is non-profit making from the Centre for Advanced Spatial Analysis, University College London and we hope it provides a new and innovative way to view the city.
View MapTube London
View the Global MapTube site.