Crooks, A. T., Hudson-Smith, A., M., Milton, R., and Batty, M. (2009), Crowdsourcing Spatial Surveys and Mapping, in Fairbairn, D. (ed.), Proceedings of the 17th Geographical Information Systems Research UK Conference, Durham University, England.
Thanks go to gisagents.blogspot.com for putting the post together:
1. Introduction
1.1. GMap Creator
1.2. MapTube

2: Near Real-Time Spatial Surveys
 Figure 2. The process of gathering, storing and creation of maps.
2.1. Mapping the Credit Crunch
credit crunch (Figure 3). However there was spatial variation around the country with more respondents within Greater London saying it was either mortgage or rent, or food as shown in Figure 4.
 Figure 3. Overall percentages for the Credit Crunch Survey.
 Figure 4. Results of the Credit Crunch Survey Focused Around London (Note: the Colour represents the Most Frequent Response in the Postcode District).
2.2. Anti-Social Behaviour in East Anglia
Anti-Social Behaviour in East Anglia.

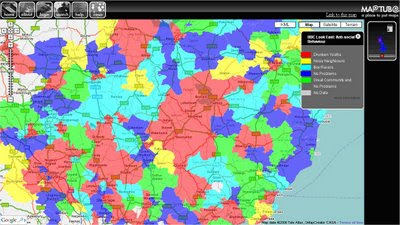 Figure 6. Results of the Anti-Social Behaviour Survey Focused Around East Anglia (Note: the Colour represents the Most Frequent Response in the Postcode District, click here to see the map).
2.3. The Manchester Congestion Charge
The Manchester Congestion Charge.

3. Geodemographic Profiles of Respondents
and a score of 50 is 50% below the national average. From such analysis it is the middle and upper classes who are over-represented within the surveys as shown in Table 2, this potentially relates to demographics of the readers, listeners, and viewers Radio 4 and the BBC news. The over representation of E-business users in the E-society classification (Table 3) suggest many respondents are answering the questionnaire while at work. Furthermore the geodemographic profiles of responses to individual questions can also be explored as seen in Table 4. Across all demographic groups the biggest concern was fuel.


4. Discussion
However, the geodemographics of the respondents shows there is an inherit bias in who is answering the questions and there is the question to whether or not respondents are influenced by the maps before answering the questions. Further work is to explore how the maps evolve over time, as each response is time stamped and how this relates to news headlines. Additionally, we are currently exploring the geodemographic profiles of each survey in more detail. We have currently re-run the credit crunch with the BBC with slightly different options to the answer.
The question remains the same – “what single factor is hurting you most about the credit crunch?” But we decided to change the categories slightly:Mortgage or rent, Petrol, Food prices, Job security, Utility bills, or Not affected. This survey ran between 5th October 2008 and 3 February 2009 and has now closed. The final map can be viewed here. During this time we received 20,072 responses, which can be broken down as follows (Figure 8): Mortgage or Rent 11.05%, Petrol 4.7%, Food Prices 11.89%, Job Security 27.25%, Utility Bills 21.92%, and Not Affected 23.20%
 Figure 8: Overall percentages for the Credit Crunch Survey
5. References
Gibin M, Singleton AD, Mateos P, and Longley PA. (2008) Exploratory cartographic visualisation of London using the Google Maps API Applied Spatial Analysis and Policy 1(2) pp85-97.
Hudson-Smith A, Crooks AT, Gibin M, Milton R, and Batty M (under review) Neogeography and Web 2.0: Concepts, Tools and Applications, Journal of Location Based Services.
Longley PA, Webber R, Li C, (2008) The UK geography of the e-society: a national classification Environment and Planning A 40(2) pp362-382.
Milton R (2008) GMap Creator, OpenLayers and OpenStreetMap CASA Blog. Available at http://blog.casa.ucl.ac.uk/?p=60 .