Richard Milton here in CASA has released a new feature on the MapTube website today which will make it easier to create new maps from data in CSV files. The new update to MapTube adds a graphical user interface which allows the user to upload a data file, choose a colour scale and publish the map on MapTube directly. As Richard states, one of the driving forces behind this was the idea that creating a map should be simple enough that you could do it using an iPad. Data on the London Datastore is in the correct format, so you can copy the CSV link directly from the site, which is exactly what has been done in the above image. Richard has created a YouTube clip showing the whole process:
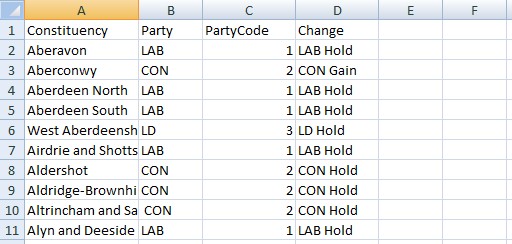
Constituency,Party,PartyCode,Change
Aberavon,LAB,1,LAB Hold
Aberconwy,CON,2,CON Gain
etc...
Government Office Regions (UK) (GOR)
Lower level super output areas (UK) (LSOA)
Medium level super output areas (UK) (MSOA)
Output Areas (UK) (OA)
Postcode Districts (UK) (PostcodeDistricts)
County and Unitary Authority (UK) (CountyUA and ONSCountyUA)
Districts (UK) (Districts and ONSDistricts)
Census Area Wards (UK) (CASWards)
World Borders 2010 (WorldBorders2010ISO2 and ISO3 using the ISO country codes)
Parliamentary Constituencies 2010 (UK) (PCON2010)
The underlying technology is used on the SurveyMapper site and for other real-time visualisations like http://bigdatatoolkit.org/2011/07/26/1yeartogo/ which shows tweets using the #1yeartogo hashtag for the London 2012 Olympics.
We aim to enhance this further over the coming months as MapTu
be is at the heart of GEMMA (Geographical Engine for Mass Mapping Applications), its an interesting step forward in rapid visualisation from data portals. Thanks as ever go to Richard for his work on MapTube and its every increasing number of users.