As part of the MRes in Advanced Spatial Analysis and Visualisation, here in CASA at The Bartlett, University College London, we are exploring new methods and techniques for visualising data. As part of the course we are looking at collecting data from the Twitter API and using the resulting .csv file as an input into a variety of software, including Processing and ArcMap.
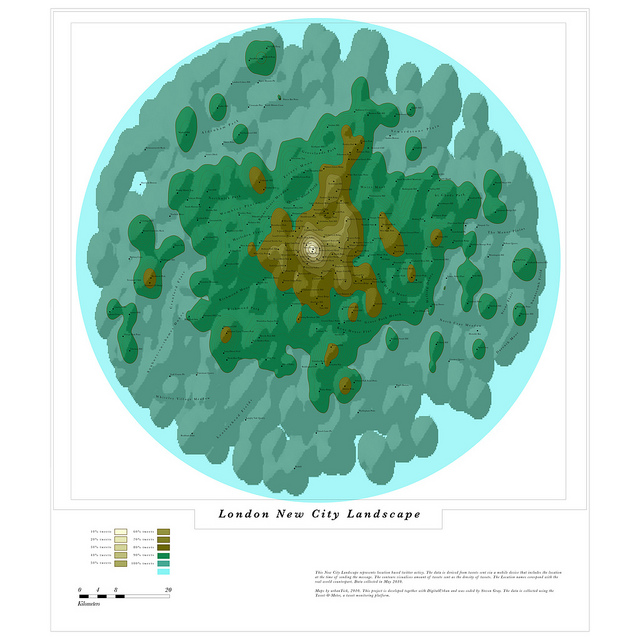 One such known example is the London Twitter map by UrbanTick, developed using the data collector created by Steven Gray and imported by Fabian into ArcMap, it developed a style of its own as the ‘NewCity Landscape’ collection. From a digital urban point of view the next stage of the map is a 3D extension, a transformation that proved surprisingly difficult due to the nature of combining the worlds of traditional GIS and game engines such as Lumion.
We are still in the early stages of development but the movie below illustrates the NewCity Landscape Map of London visualisation in Lumion as a ‘Twitter Island’:
Music by Pigeman over at MP3 Unsigned. There are of course many arguments on the pro’s and con’s of visualising data in such a way, indeed the visualisation is developed to open up the debate as part of the MRes course allowing various visualisation techniques to be compared from the same data set.
We will have more updates as the visualisation develops, along with a walk through of how to build it. If your interested in such output our MRes is now open for applications, entry 2012-2013…
3 Comments