The title is, of course, controversial. The question, however, comes from the closing section of a 2020 paper by Wargent, M., Moore, T., & Tomaney, J. (2020), and arguably, it’s looking like the answer is Yes, and soon. The impact will be profound, bringing with it impacts not only to the day-to-day professionals on the ground practising the art of planning but also the various planning schools around the country.
The role of Planning in the UK is clearly at a crossroads, in the line of sight of savings cuts and AI while the concept of Digital Planning finally comes into focus. There is the excellent Digital Task Force, The Connected Places Catapult and others looking at the future of the planning system; indeed, my own department at University College London suggested an ‘Online Planning’ system back in 2002. At that point, tech was seen as ‘for nerds’ as the RTPI Magazine wonderfully retitled our work, somehow failing to grasp the importance of digital on the future of the profession.
Fast forward 20 years onwards and Digital Planning is finally a thing, but it is arguably too late and the digital technology they are racing to embrace is the very technology that will replace them. Of course, such views are perhaps controversial, some would say clickbait, but it seems to be the elephant in the room. At various Catapult, Government, academic and social events no one really seems to be doing a proper future cast and it’s not even the distant future, it’s merely looking 5 to 10 years out. A future where not only the planner but also planning schools could be replaced by the technology the sector failed to see coming.
The smoking gun in this is the equally controversial £8.33 million tender for the “MHCLG Augmented Planning Decisions“.
The tender seeks to develop a planning tool that enables AI-augmented decision making for planning applications. The initial focus will be on householder developments (as defined in Town and Country Planning (Development Management Procedure) (England) Order 2015) with a view to expand into further application types within the ‘other’ category (those not classified as Major or Minor) which represent 69% of all planning applications. The objective is to dramatically reduce planning application processing times initially targeting a reduction from upwards of 8 weeks to circa 4 weeks, with a long-term vision of near-instant decisions for straightforward applications.
It signals the shift from people talking about AI to actively making it part of the system. This framework looks to create a government “App Store,” allowing 350+ local councils to instantly procure AI-driven tools to digitise their plans, automate validation, and process applications.
But this move also begs two questions. First, why is the government fumbling with an £8.3 million framework when it could just ask Google, Elon Musk or Microsoft to fix the problem?
And second, the one that really matters to thousands of people on the ground, reading between the lines it’s actually about cost savings across local government, something of course people will deny, but in reality, it’s using technology to automate the system and thus design out the planner.
It’s tempting to look at that £8.3 million figure and see it as a sign the government is “late” or “cheap,” especially when Big Tech firms wield billion-dollar AI models. But this misunderstands the problem. The government will have, of course, talked to the big players but the problem is more complex. Google’s AI is “horizontal”—it knows a little about everything. UK planning is a “vertical” problem—it requires deep, specialist knowledge of a niche, legally complex system. A generalist AI doesn’t know what a Section 106 agreement is, nor does it care about the specific, contradictory policies of 350 different local councils. Although arguably the technology is moving so rapidly that we already have people in our department saying they could build it in a week and tbh a demo could be built rapidly and at low cost, but it’s mainly due to the fact that the UK planning sector is a tiny, unprofitable market.
The problem is critical for national infrastructure but perhaps too small for tech giants to solve. The government must therefore step in to create a market. This tender is an £8.3 million signal to smaller, specialist “PropTech” companies: “If you build the niche tools, we will guarantee you a path to market.” It also addresses the issue of handing all the UK’s sensitive planning data to a single tech giant which would be a legal, political, and data-sovereignty challenge.
This framework is therefore perhaps a pragmatic and necessary step to build a specialist, competitive market for the specific tools the system actually needs, but also one that risks putting its own data into a black box with issues around trust around the algorithms and plunging itself back into service agreements with whoever wins the tender – arguably the focus should be on an open source system but behind it will also be the need to commercialise. So the system shoots itself in the foot.
Who Gets Replaced?
Let’s be brutally honest. The government’s goal of achieving £45 billion in public sector savings isn’t just about making planners’ lives easier. It’s about automation, and automation replaces human tasks. The tools being procured by this framework are aimed squarely at the “low-hanging fruit” of the planning system.
The “on the ground” roles most at risk are not the senior planners, but the vital administrative and technical staff that support them.
The Validation Officer: Their job is a manual, checklist-based task: “Are all 50+ required documents present?” An AI can do this in 0.2 seconds. This role is the primary target for automation.
The Planning Admin: Their role involves scanning, redacting, and uploading thousands of public consultation comments. An AI can read, group by theme (e.g., “Parking: 4,520 objections”), and summarise 10,000 comments before a human has finished their first coffee.
The Junior Planner / Technician: A part of their early-career work is the “science” of planning: looking up policies, using GIS systems, and cross-referencing a proposal against 500 pages of the Local Plan. An AI, trained on a new, digitised Local Plan, will do this instantly, flagging every breach.
For the people in these roles, AI is not an “augmenting” tool; it is a replacement. This will lead to leaner, smaller planning departments, which is precisely the “cost-saving” and “efficiency” the government is aiming for.
What’s Left? The Planner as the ‘Human-in-the-Loop’
If AI is automating validation, consultation, and policy-checking, what is the MSc-qualified planner left to do?
The positive view would be everything. They are finally freed from being a process manager and can become the strategic expert they were trained to be. The planner’s new role will be to manage the AI’s output, overrule it, and apply the 20% of human skills that create 80% of the value. The AI can do the “science,” but not the “art.” Sadly I don’t think that’s actually true and AI is coming for the “Art” part as well, including design and architecture, but that’s another post.
So will AI Push the human planner to the point of irrelevance? – I would argue yes and this post can be revisited by those (many) who will disagree in 10 years’ time. We were right almost 20 years ago when we called for a Digital Planning system but the speed of AI has caught most of us out and the government talks about pushing the UK’s tech sector while also seeing savings out of the corner of its eye.
The implications for planning education are profound. The “routine” administrative and technical jobs—the validation roles, the junior policy-checking—are the very “on-ramp” positions that MSc graduates have relied on for decades to enter the profession and they will be gone. If AI automates this bottom layer, the profession is “hollowed out” from the bottom up. The only point of entry will be at a higher, strategic level. This creates a crisis for universities:
The MSc curriculum must change, fast (and that’s something its not good at). It can no longer just be about law, theory, and placemaking (the “art”). It must now formally integrate data science, digital literacy, and AI ethics (the “science”).
The planner’s role shifts. The graduate of 2027 will be an ‘AI-manager’ and ‘ethical gatekeeper’, whose job is to question, interpret, and overrule the AI’s “near-instant” recommendations. Of course planning sits within a regulatory framework, so arguably along side AI will be a relaxation in some of the roles of planning committes, allowing a more automated system to go forward, perhaps we are already seeing some hints at this moving forward.
Future planners will be feeders and checkers of the Algorithm – typing in ‘make me a local plan for…. add in 1000 homes with a mixed development in the least controversial areas’ and checking, tweaking what comes out – still planning but different from what we have ever known before.
What comes out of AI is currently viewed as ‘AI Slop’ but it will only remain slop for a short while. The shift is coming and it’s no longer Digital Planning it’s Automated AI Generated Planning – one that has a higher level of expertise than a human.
Let’s just hope the output of the £8 million call is not a black box system linked to a monthly service charge for use with an algorithm that people in suits say has been tested but has the potential to blight our future landscape for years to come – the one thing about Models and Planning is they don’t actually work, life is simply more complex that the data we put in, and in the shake-down in 10 years’ time, that might be where the human wins and actually the human replaces AI.
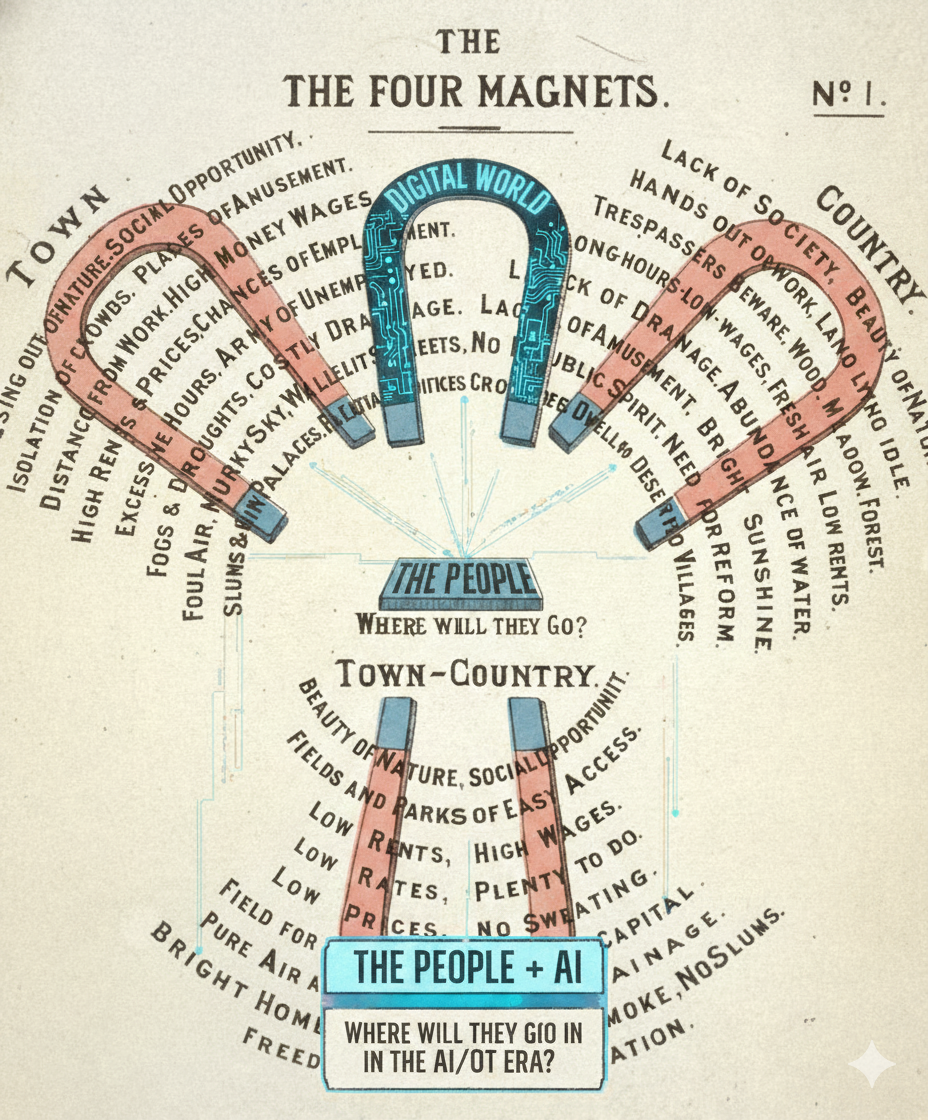
Note – this text forms part of a thought piece for the forthcoming co-authored book Digital Cities of Tomorrow.
Wargent, M., Moore, T., & Tomaney, J. (2020). Will AI push the human planner to the point of irrelevance? Planning Theory & Practice, 21(4), 652-658. DOI: 10.1080/14649357.2020.1776014)