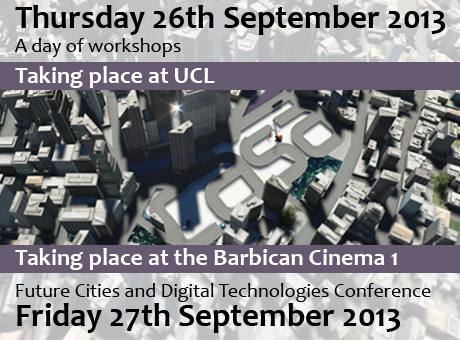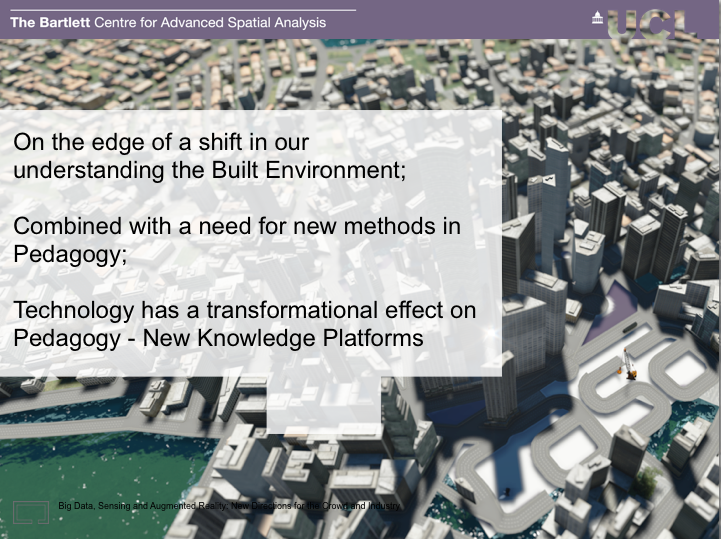
In June 2013 The Bartlett held a conference entitled ‘Pedagogy meets Big Data and BIM’. The conference brought together over 100 participants from across the United Kingdom, European Union and the United States from diverse backgrounds such as academic institutions, government and industry – including ARUP, Autodesk, Balfour Beatty, BAM, and Royal Institute of British Architects. The Faculty’s motivation to focus on BIM (Building Information Modelling) and Big Data (deriving from the exponential growth of the profession’s access to spatial statistics) was the realisation that innovation, collaboration and technology are rewriting industry practice in profound ways and must also reshape the built environment curricula. I was lucky enough to be asked to present the key note to the conference, below is the short paper produced along with the full key note presentation:
Big Data, Sensing and Augmented Reality – New Directions for The Crowd and Industry
Andrew Hudson-Smith
Director, The Bartlett Centre for Advanced Spatial Analysis, http://www.casa.ucl.ac.uk / http://www.digitalurban.org, @digitalurban
Everyday we create 2.5 quintillion bytes of data — so much that 90% of the data in the world today has been created in the last two years alone. This data comes from everywhere: sensors used to gather climate information, posts to social media sites, digital pictures and videos, purchase transaction records, and cell phone GPS signals to name a few (IBM, 2013). This data, compared to traditional data sources, can arguably be defined as ‘big’ with cities and urban environments the main source of this data creation. Every minute 100,000 tweets are sent globally, Google receives 2,000,000 search requests and users share 684,478 pieces of content on Facebook (Mashable, 2012). An increasing amount of this data stream is geolocated, from Check-ins via Foursquare through to Tweets and searches via Google Now. These streams of data that cities and individuals emit can be collected and viewed to make the data city visible, aiding our understanding of not only how urban systems operate but opening up the possibility of a real-time view of the city at large (Hudson-Smith, 2013). This paper and presentation explores the rise in big data and the need to link Building Information Modelling (BIM) to Geographic Information Systems (GIS), Citizen Science and finally the Internet of Things (IoT). This four-way linkage, we argue, is key to the generation of the future smart city, a city that will be viewed via augmented reality. We explore various augmented reality systems and conclude that the next decade will see the fall of the smart phone and the rise of electroencephalograph embedded devices with information sent directly to our retinas – this is, we argue, the future of big data, sensing and augmented reality in relation to the built environment.
Data
Over the last 5 years there has been a turning point in the availability of data related to the urban environment. Systems such as The London Data Store, a download data service from the Greater London Authority (GLA), stand out as first steps towards opening up data related to the city. The store was developed with the ethos of allowing anyone to access the data that the GLA and other public sector organisations hold and to use the data however they see fit – for free (GLA, 2013). With on-going development as part of a European wide Smart Cities project known as iCity, the Date Store has, to date, stimulated over 70 mobile applications linking to the 500+ datasets and a combination of the 27 real-time live traffic and transport data feeds. The key to opening up our understanding of the city is the joining of such datasets with other feeds and systems. The collection and visualisation of live data, linked to current systems such as the established BIM and GIS sectors, and the emerging citizen science and IoT movements is central to this ethos. The Internet of Things, a term attributed to the Auto-ID research group at MIT in 1999, denotes the idea that in future every object will have an online presence (de Jode et al, 2012). Information from occupancy rates through to ambient temperature can be collected using sensors linked to IoT, combined with location and time attributes it moves from the hyper-local view of the sensor through the macro scale of an urban system. IoT is still in its infancy with systems ranging from Xively (https://xively.com/) and an array of numerical data through to Tales of Things (http://www.talesofthings.com) and its narrative based take on objects. It is however estimated that over 6 billion objects will be connected to the internet by 2015 (Anita Bunk, 2013). These objects will form the backbone of future smart buildings, BIM systems, and ultimately,the smart city for data analysis, predictive modelling and visualisation.
Citizen
The current theme in many research fields is citizen science. As (Haklay, 2010) states, using citizen science can take a form in which volunteers put their efforts to a purely scientific endeavour, such as mapping galaxies, or a different form that might be termed ‘community science’ in which scientific measurements and analysis are carried out by members of local communities so they can develop an evidence base and set action plans to deal with problems in their area. Largely driven by the rise in mobile phone ownership and access to networked technology, ‘the crowd’ is both a provider and user of data. Access to social networks is a key source of crowd based data, almost all the main social network providers allow access to data feeds via an Application Interface (API), this allows data to be collected or mined. These API’s are central to the current ability to make sense of these growing streams of data. One of the most popular current social networks is Twitter, created in 2006 the network now was 500 million registered users with over 340 million tweets made daily. Twitter allows users to send a message up to 140 characters in length; a tweet can contain links to other web based content, user name and a user’s location. At The Bartlett Centre for Advanced Spatial Analysis we have developed a variety of techniques and toolkits to mine and track this variety of network data, from the IoT through to the crowd, often with location and time as the linking theme.
Pedagogy meets Big Data and BIM
Future Connected Systems
Arguably, the core unifying aspect of data is location and time. As such, on-site augmented reality systems, similar in characteristic to the forthcoming Google Glass, have the potential to join up the smart city. Powered by BIM, GIS, IoT and the crowd, such systems will embed a new range of sensors to capture and share the ‘emotion of place’ while streaming in data. Taking a look at current number of complex systems it is clear that there is a need to join up and simplify urban data acquisition and analysis, the move to augmented reality may provide this unique opportunity.
Key Note Presentation and Demos:
References
Bunk, A. (2013), The Internet of Things, http://blog.bosch-si.com/
de Jode M., Barthel R., Rogers J., Karpovich A., Hudson-Smith A., Quigley M. and Speed C.”Enhancing the ‘second-hand’ retail experience with digital object memories”, Proceedings of the 2012 ACM Conference on Ubiquitous Computing, Pittsburgh, Pennsylvania, 2012, pp 451-460.
GLA. (2013), The London Datastore,http://data.london.gov.uk/datastore/about.
Haklay, M (2010) Geographical Citizen Science – Clash of Cultures and New Opportunities. In: (Proceedings) Workshop on the Role of Volunteered Geographic Information in Advancing Science, GIScience 2010.
Hudson-Smith (2013), Tagging and Tracking, Architectural Design, forthcoming.
IBM. (2013), Big Data at the Speed of Business, http://www-01.ibm.com/software/data/bigdata/
Mashable. (2012), How Much Data is Created Every Minute? http://mashable.com/2012/06/22/data-created-every-minute/