MQTT Weather Dashboard

Enhancing Live Weather Monitoring with MQTT and Chart.js

By data, Data Visualisation, Weather, Weather (Live), Weather Display No Comments

Introduction

Viewing real-time data from a personal weather station such as a Davis Vantage Pro, a Tempest, or an EcoWhitt device can be complex. However, the majority of systems that process weather data, such as Weather Display, Weewx, or CumlusMx, all have the ability to output MQTT data. This data can be used to display a real-time graph of the data, keeping you engaged with the latest weather updates, and supplemented with any other data which is MQTT-based.

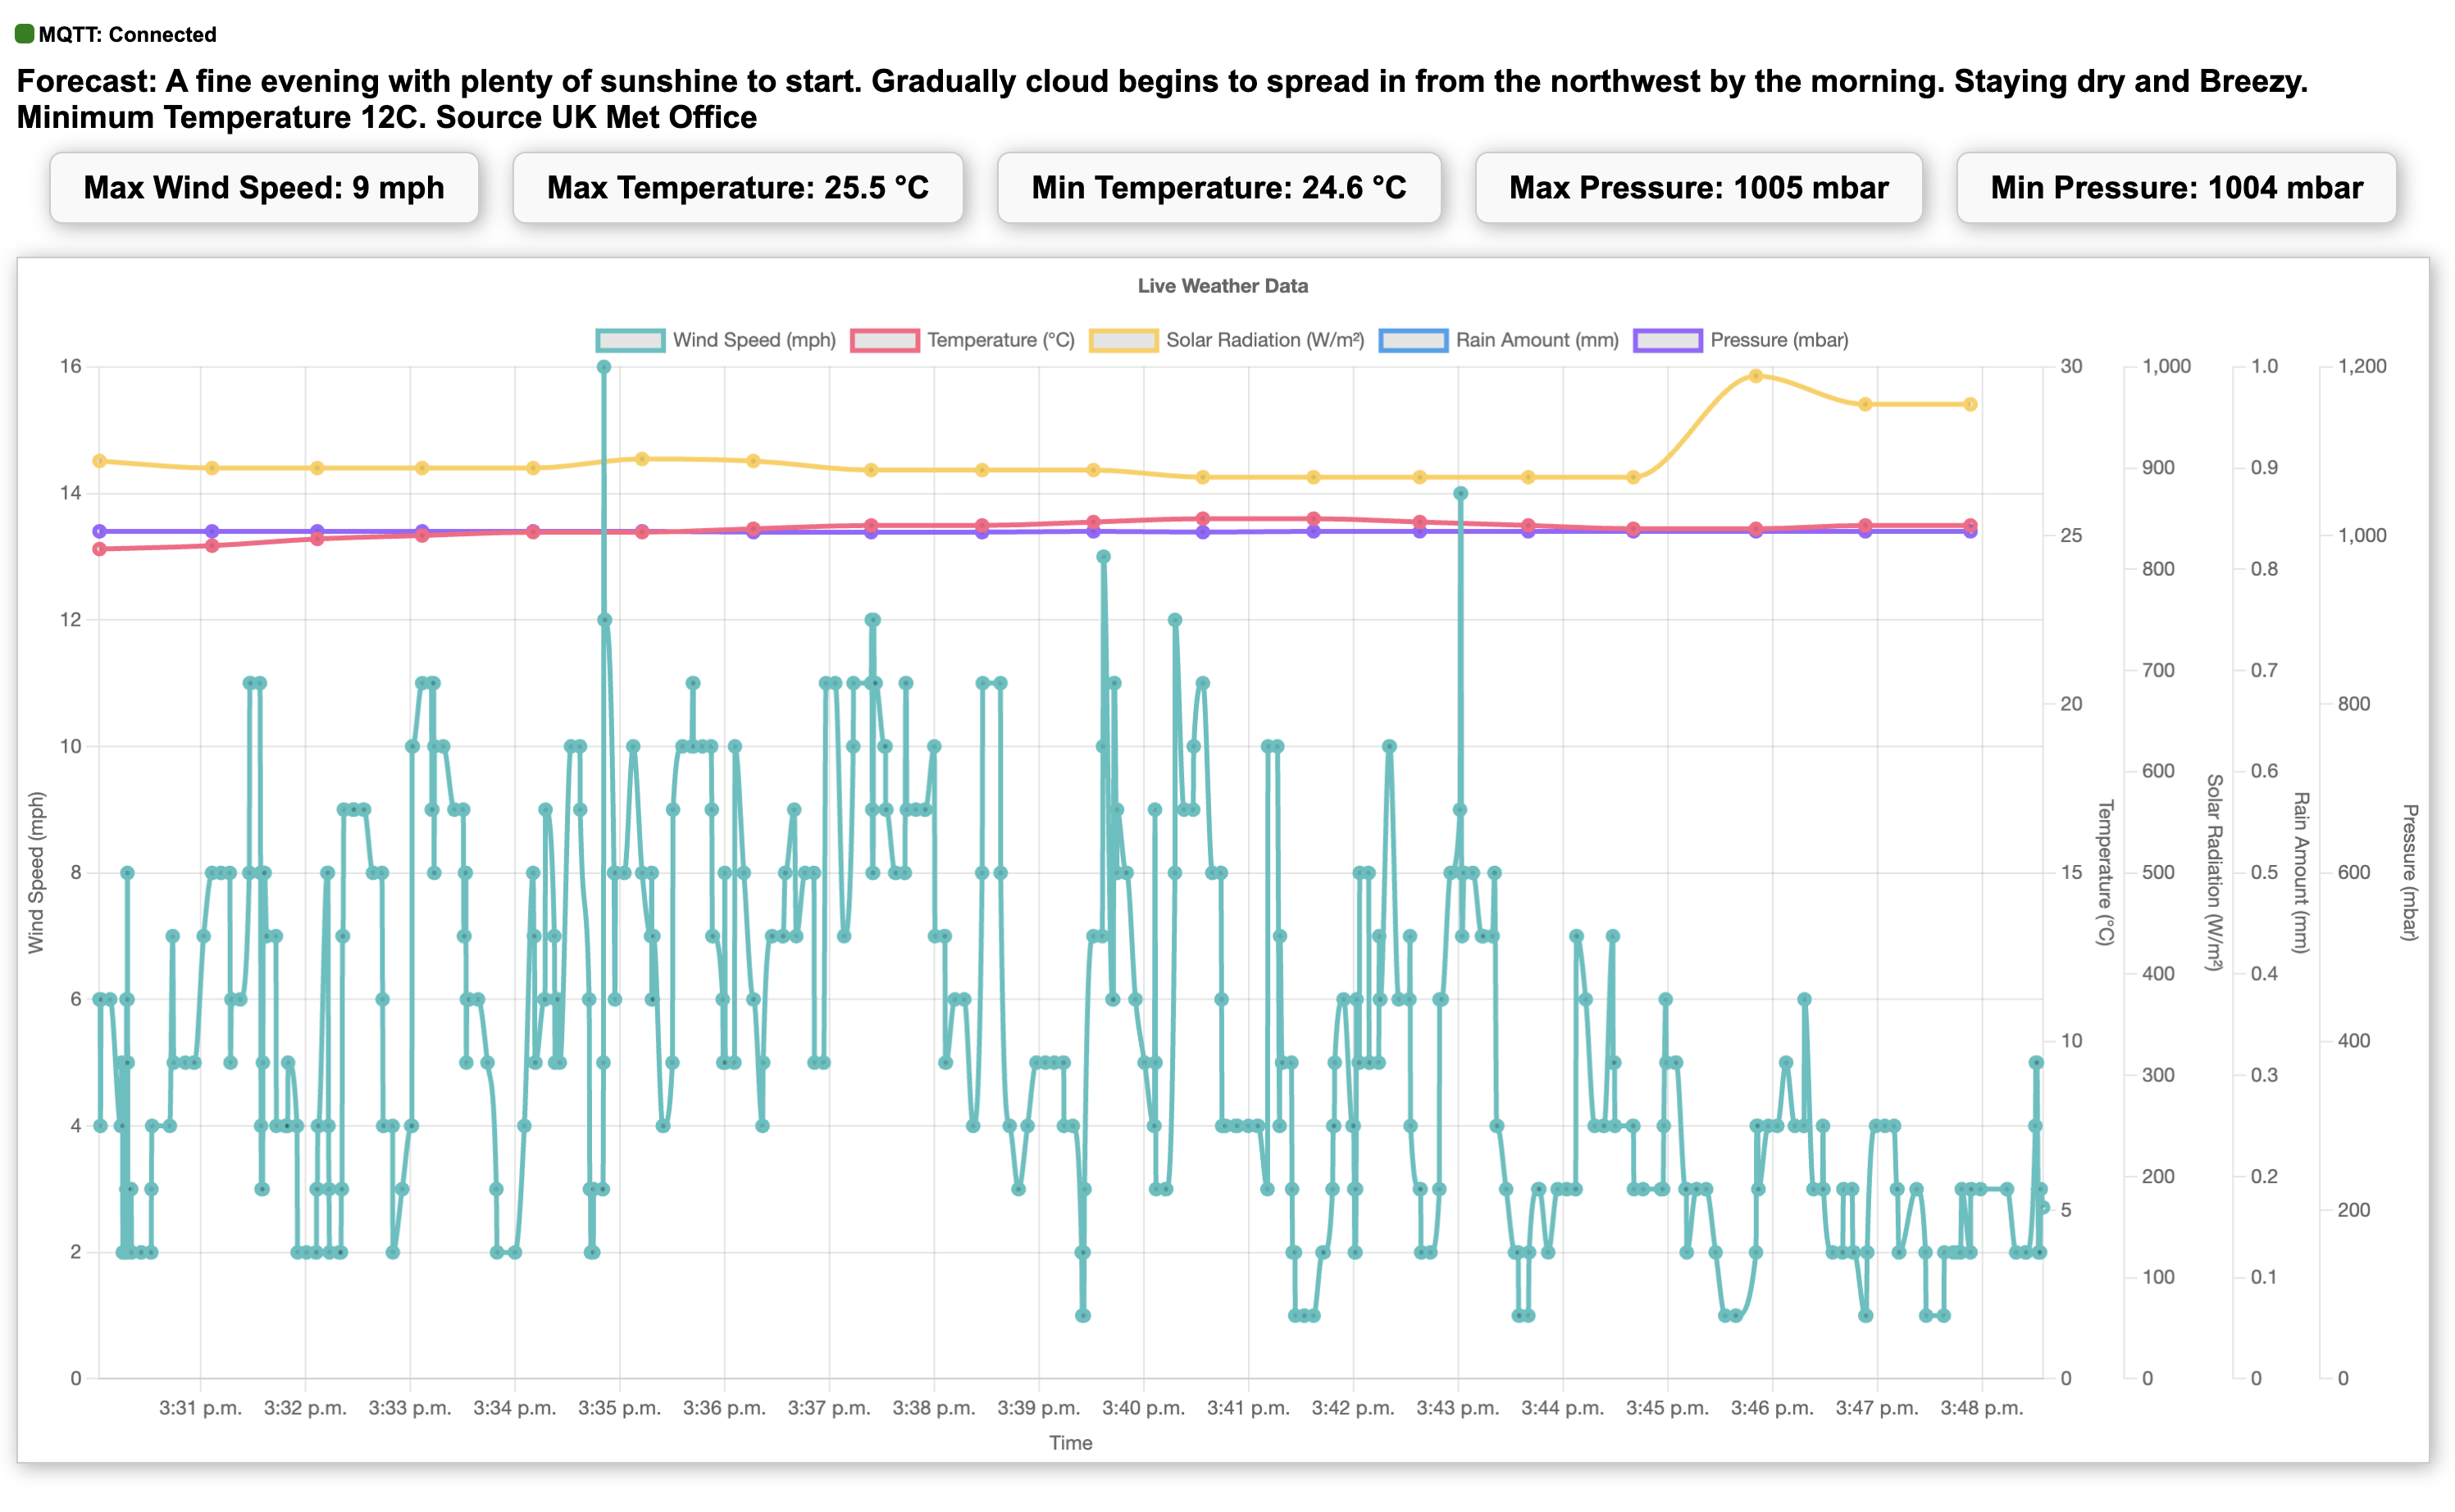
With this in mind, we’ve developed a live weather monitoring dashboard as an illustrative example. This dashboard uses MQTT for real-time data updates and Chart.js for dynamic visualization. We’ve also included a visual indicator for connection status and a brief pulse effect to notify when new data arrives, enhancing the user experience.

MQTT Weather Dashboard

You can view it live at: https://finchamweather.co.uk/weathergraph.htm

The data populates as the page loads – we could of course back load it via a database link, but the aim was to simply use MQTT and have a graphing system that streams in data, its a work in progress but here is how we got it working:

Setting Up the Environment

Before we dive into the code, ensure you have the following libraries included in your HTML:

  • Paho MQTT: for MQTT protocol handling – our MQTT feed is open to use as a test, replace this with your own MQTT details in the main code.
  • Chart.js: for creating dynamic charts
  • Chart.js adapter for date-fns: for handling time scales in charts

Initial HTML Setup

We’ll start by setting up the basic HTML structure. This includes elements for displaying the connection status, forecast, weather statistics, and the weather chart.

<!DOCTYPE html>
<html lang="en">
<head>
    <meta charset="UTF-8">
    <meta name="viewport" content="width=device-width, initial-scale=1.0">
    <meta name="apple-mobile-web-app-capable" content="yes">
    <meta name="apple-mobile-web-app-status-bar-style" content="black">
    <title>Live Weather Graph</title>
    <script src="https://cdnjs.cloudflare.com/ajax/libs/paho-mqtt/1.0.1/mqttws31.js"></script>
    <script src="https://cdn.jsdelivr.net/npm/chart.js"></script>
    <script src="https://cdn.jsdelivr.net/npm/chartjs-adapter-date-fns"></script>
    <style>
        body {
            font-family: Arial, sans-serif;
            margin: 20px;
        }
        #mqttStatus {
            margin-bottom: 20px;
            text-align: left;
            font-size: 1.2em;
        }
        .dot {
            height: 20px;
            width: 20px;
            border-radius: 50%;
            display: inline-block;
        }
        .green {
            background-color: green;
        }
        .red {
            background-color: red;
        }
        .orange {
            background-color: orange;
        }
        .pulse-once {
            animation: pulse-once 1s;
        }
        @keyframes pulse-once {
            0% { transform: scale(1); }
            50% { transform: scale(1.2); }
            100% { transform: scale(1); }
        }
        #forecast {
            margin-bottom: 20px;
            text-align: left;
            font-size: 1.2em;
            font-weight: bold;
        }
        #stats {
            display: flex;
            justify-content: center;
            gap: 20px;
            margin-bottom: 20px;
            font-size: 1.2em;
            font-weight: bold;
        }
        #stats div {
            padding: 10px 20px;
            border: 1px solid #ccc;
            border-radius: 8px;
            box-shadow: 2px 2px 12px #aaa;
            background-color: #f9f9f9;
        }
        canvas {
            border: 1px solid #ccc;
            box-shadow: 2px 2px 12px #aaa;
        }
    </style>
</head>
<body>
    <div id="mqttStatus"><span id="connectionDot" class="dot red"></span> mqtt: disconnected</div>
    <div id="forecast">Forecast: Loading...</div>
    <div id="stats">
        <div id="maxWindSpeed">Max Wind Speed: 0 mph</div>
        <div id="maxTemp">Max Temperature: 0 °C</div>
        <div id="minTemp">Min Temperature: 0 °C</div>
        <div id="maxPressure">Max Pressure: 0 mbar</div>
        <div id="minPressure">Min Pressure: 0 mbar</div>
    </div>
    <canvas id="weatherChart" width="800" height="400"></canvas>
</body>
</html>

Connecting to MQTT

Next, we set up the MQTT connection. The MQTT client will connect to the broker, subscribe to the necessary topics, and handle messages when they arrive.

// MQTT connection settings
var mqtt;
var reconnectTimeout = 2000;
var host = "mqtt.cetools.org";
var port = location.protocol === 'https:' ? 8081 : 8080;
var options = {
    timeout: 3,
    onSuccess: onConnect,
    onFailure: onFailure,
    useSSL: location.protocol === 'https:',
};
var clientID = "clientID" + parseInt(Math.random() * 100);

function updateConnectionStatus(status) {
    const dot = document.getElementById("connectionDot");
    if (status === "connected") {
        dot.className = "dot green";
        document.getElementById("mqttStatus").innerHTML = `<span class="dot green" id="connectionDot"></span> mqtt: connected`;
    } else if (status === "disconnected") {
        dot.className = "dot red";
        document.getElementById("mqttStatus").innerHTML = `<span class="dot red" id="connectionDot"></span> mqtt: disconnected`;
    } else if (status === "reconnecting") {
        dot.className = "dot orange";
        document.getElementById("mqttStatus").innerHTML = `<span class="dot orange" id="connectionDot"></span> mqtt: reconnecting`;
    }
}

function pulseDot() {
    const dot = document.getElementById("connectionDot");
    dot.classList.add("pulse-once");
    setTimeout(() => {
        dot.classList.remove("pulse-once");
    }, 1000); // Duration of the pulse-once animation
}

function onFailure(message) {
    console.log("Connection Attempt to Host " + host + " Failed: ", message.errorMessage);
    updateConnectionStatus("disconnected");
    setTimeout(MQTTconnect, reconnectTimeout);
}

function onConnect() {
    console.log("Connected ");
    updateConnectionStatus("connected");
    mqtt.subscribe("personal/ucfnaps/downhamweather/loop");
    mqtt.subscribe("personal/ucfnaps/eink/met");
}

function MQTTconnect() {
    console.log("Connecting to " + host + " on port " + port);
    updateConnectionStatus("reconnecting");
    mqtt = new Paho.MQTT.Client(host, port, clientID);
    mqtt.onMessageArrived = onMessageArrived;
    mqtt.onConnectionLost = function(responseObject) {
        if (responseObject.errorCode !== 0) {
            console.log("Connection Lost: " + responseObject.errorMessage);
            updateConnectionStatus("disconnected");
            setTimeout(MQTTconnect, reconnectTimeout);  // Attempt to reconnect
        }
    };
    mqtt.connect(options);
}

window.onload = function() {
    MQTTconnect();
}

Handling Incoming Messages

When messages arrive, we process the data and update the chart. We also update the connection dot to pulse briefly, indicating new data has been received.

let lastUpdate = Date.now();  // Initialize to current time
let firstUpdate = true;  // Flag to ensure first update happens immediately

let maxWindSpeed = 0;
let maxTemp = -Infinity;
let minTemp = Infinity;
let maxPressure = -Infinity;
let minPressure = Infinity;

function updateWindSpeed(windSpeed, timestamp) {
    weatherChart.data .labels.push(timestamp);
    weatherChart.data.datasets[0].data.push(windSpeed);

    // Update max wind speed
    if (windSpeed > maxWindSpeed) {
        maxWindSpeed = windSpeed;
        document.getElementById('maxWindSpeed').innerText = `Max Wind Speed: ${maxWindSpeed} mph`;
    }

    // Limit the number of data points to keep the chart responsive
    if (weatherChart.data.labels.length > 1440) { // Assuming 1 data point per minute, keep 24 hours of data
        weatherChart.data.labels.shift();
        weatherChart.data.datasets[0].data.shift();
    }

    weatherChart.update();
}

function updateOtherMetrics(temperature, solarRadiation, rainAmount, pressure, timestamp) {
    weatherChart.data.datasets[1].data.push({x: timestamp, y: temperature});
    weatherChart.data.datasets[2].data.push({x: timestamp, y: solarRadiation});
    weatherChart.data.datasets[3].data.push({x: timestamp, y: rainAmount > 0 ? rainAmount : null});
    weatherChart.data.datasets[4].data.push({x: timestamp, y: pressure});

    // Update max and min temperature
    if (temperature > maxTemp) {
        maxTemp = temperature;
        document.getElementById('maxTemp').innerText = `Max Temperature: ${maxTemp} °C`;
    }
    if (temperature < minTemp) { minTemp = temperature; document.getElementById('minTemp').innerText = `Min Temperature: ${minTemp} °C`; } // Update max and min pressure if (pressure > maxPressure) {
        maxPressure = pressure;
        document.getElementById('maxPressure').innerText = `Max Pressure: ${maxPressure} mbar`;
    }
    if (pressure < minPressure) { minPressure = pressure; document.getElementById('minPressure').innerText = `Min Pressure: ${minPressure} mbar`; } // Limit the number of data points to keep the chart responsive if (weatherChart.data.labels.length > 1440) { // Assuming 1 data point per minute, keep 24 hours of data
        weatherChart.data.datasets[1].data.shift();
        weatherChart.data.datasets[2].data.shift();
        weatherChart.data.datasets[3].data.shift();
        weatherChart.data.datasets[4].data.shift();
    }

    weatherChart.update();
}

function updateForecast(forecast) {
    document.getElementById('forecast').innerText = `Forecast: ${forecast}`;
}

function onMessageArrived(message) {
    console.log("Message Arrived: " + message.destinationName + " : " + message.payloadString);
    if (message.destinationName === "personal/ucfnaps/downhamweather/loop") {
        const data = JSON.parse(message.payloadString);
        const windSpeed = data['windSpeed_mph'];  // Adjust this key according to your data structure
        const temperature = data['outTemp_C'];  // Adjust this key according to your data structure
        const solarRadiation = data['radiation_Wpm2'];  // Adjust this key according to your data structure
        const rainAmount = data['dayRain_mm'];  // Adjust this key according to your data structure
        const pressure = data['pressure_mbar'];  // Adjust this key according to your data structure

        const nowTimestamp = new Date();

        // Update wind speed every time
        updateWindSpeed(windSpeed, nowTimestamp);

        if (firstUpdate || Date.now() - lastUpdate >= 60000) {
            // Update other metrics every minute
            updateOtherMetrics(temperature, solarRadiation, rainAmount, pressure, nowTimestamp);
            lastUpdate = Date.now();
            firstUpdate = false;  // Ensure subsequent updates follow the interval
        }

        // Pulse the dot when new data arrives
        pulseDot();
    } else if (message.destinationName === "personal/ucfnaps/eink/met") {
        const forecast = message.payloadString;
        updateForecast(forecast);
    }
}

Chart.js Setup

Now, let’s configure Chart.js to visualize the weather data. We will use multiple datasets to display wind speed, temperature, solar radiation, rain amount, and pressure.

// Chart.js setup
const ctx = document.getElementById('weatherChart').getContext('2d');
const weatherChart = new Chart(ctx, {
    type: 'line',
    data: {
        labels: [],  // Time labels
        datasets: [{
            label: 'Wind Speed (mph)',
            data: [],
            borderColor: 'rgba(75, 192, 192, 1)',
            borderWidth: 3,
            fill: false,
            yAxisID: 'y-axis-1',
            tension: 0.1
        },
        {
            label: 'Temperature (°C)',
            data: [],
            borderColor: 'rgba(255, 99, 132, 1)',
            borderWidth: 3,
            fill: false,
            yAxisID: 'y-axis-2',
            tension: 0.1
        },
        {
            label: 'Solar Radiation (W/m²)',
            data: [],
            borderColor: 'rgba(255, 206, 86, 1)',
            borderWidth: 3,
            fill: false,
            yAxisID: 'y-axis-3',
            tension: 0.1
        },
        {
            label: 'Rain Amount (mm)',
            data: [],
            borderColor: 'rgba(54, 162, 235, 1)',
            borderWidth: 3,
            fill: false,
            yAxisID: 'y-axis-4',
            tension: 0.1
        },
        {
            label: 'Pressure (mbar)',
            data: [],
            borderColor: 'rgba(153, 102, 255, 1)',
            borderWidth: 3,
            fill: false,
            yAxisID: 'y-axis-5',
            tension: 0.1
        }]
    },
    options: {
        responsive: true,
        plugins: {
            legend: {
                position: 'top',
            },
            title: {
                display: true,
                text: 'Live Weather Data'
            },
            decimation: {
                enabled: true,
                algorithm: 'lttb',
                samples: 100,  // Adjust this value as needed for performance
            },
        },
        scales: {
            x: {
                type: 'time',
                time: {
                    unit: 'minute'
                },
                title: {
                    display: true,
                    text: 'Time'
                }
            },
            'y-axis-1': {
                type: 'linear',
                position: 'left',
                beginAtZero: true,
                title: {
                    display: true,
                    text: 'Wind Speed (mph)'
                }
            },
            'y-axis-2': {
                type: 'linear',
                position: 'right',
                beginAtZero: true,
                title: {
                    display: true,
                    text: 'Temperature (°C)'
                },
                grid: {
                    drawOnChartArea: false
                }
            },
            'y-axis-3': {
                type: 'linear',
                position: 'right',
                beginAtZero: true,
                title: {
                    display: true,
                    text: 'Solar Radiation (W/m²)'
                },
                grid: {
                    drawOnChartArea: false
                }
            },
            'y-axis-4': {
                type: 'linear',
                position: 'right',
                beginAtZero: true,
                title: {
                    display: true,
                    text: 'Rain Amount (mm)'
                },
                grid: {
                    drawOnChartArea: false
                }
            },
            'y-axis-5': {
                type: 'linear',
                position: 'right',
                beginAtZero: true,
                title: {
                    display: true,
                    text: 'Pressure (mbar)'
                },
                grid: {
                    drawOnChartArea: false
                }
            }
        },
        interaction: {
            intersect: false,
            mode: 'nearest',
        },
        elements: {
            line: {
                cubicInterpolationMode: 'monotone',
            },
        },
    }
});

Conclusion

By integrating MQTT and Chart.js, it is possible to create a dynamic and real-time weather monitoring dashboard. The connection status indicator provides immediate feedback on the connection state, and the pulsing effect when new data arrives enhances user experience by visually notifying them of updates.

This setup can be further extended by adding more datasets, customizing the chart’s appearance, or integrating additional sensors. The data of course couple be from any feed, but real-time weather monitoring provides a good example of how IoT and web technologies can be combined to create realtime dashboards.

Creating Art Like Weather Forecast Images with DALL·E 3 and API Data

By Art, Making, Weather

Introduction

The Met Office, as the national meteorological service for the United Kingdom, provides valuable weather data through its API called DataPoint. This API caters to a wide range of users, including professionals, scientists, students, and amateur developers. One of its notable features is the availability of text-based regional weather forecasts.

However, traditional text-to-image systems often struggle with accurately representing descriptive language. Users often find themselves navigating the complexities of prompt engineering to achieve their desired visual output. However, things are rapidly chaning with the use of AI and OpenAI’s latest release, DALL·E 3, simplifies this process by generating images that align with the provided text.

In this blog post, we’ll explore how to combine Met Office weather forecasts with DALL·E 3 via its API using Python. Our goal? To create captivating landscape imagery that reflects the weather conditions described in the forecast. Our images are then uploaded to our webserver, using FTP for viewing online. If you simply want to create an image, then you can leave the FTP section out.

The Workflow

  1. Met Office Data Retrieval:
    • We fetch the weather forecast data from the Met Office DataPoint API. Specifically, we focus on today’s weather conditions. We are using the UK metoffice, but it could be any weather api, from any country, that returns forecast text.
  2. Creating the Image Prompt:
    • We construct an image prompt that encapsulates the essence of the weather. Our prompt includes the landscape type (e.g., “rural Norfolk landscape”) and the specific weather details obtained from the Met Office. The landscape type can be edited accordingly
  3. DALL·E 3 Image Generation:
    • Leveraging OpenAI’s DALL·E 3 model, we generate an image based on the provided prompt. The image should realistically depict cloud formations, sunlight, precipitation, and wind effects, all while capturing the mood suggested by the weather.
  4. FTP Upload:
    • Finally, we upload the generated image to an FTP server for public access.

We run the script every 12 hours (ours runs on a Raspberry Pi) with the images archived on the websever – the gallery below shows some of the images from the last few months:

The full code can be seen below, with the latest version available via our GitHub repository.

# Import necessary libraries
import ftplib
import requests
from PIL import Image
import io
from bs4 import BeautifulSoup
from datetime import datetime

# Get Met Office Data and Strip Today/Tonight Text
url = 'http://datapoint.metoffice.gov.uk/public/data/txt/wxfcs/regionalforecast/xml/512?key=YOURMETOFFICEAPIKEY'
document = requests.get(url)
soup = BeautifulSoup(document.content, "lxml-xml")

# Extract today's weather forecast
todayraw = soup.find_all("Paragraph", attrs={'title': 'Today:'})
todaystr = str(todayraw)
today = (todaystr.replace('[<Paragraph title="Today:">', '').replace('</Paragraph>', '').replace(']', ''))

# Set up OpenAI API key
from openai import OpenAI
client = OpenAI(api_key='YourOpenAIAPIKey')

# FTP server details
ftp_server = 'YourFTPServer'
ftp_username = 'FTPUserName'
ftp_password = 'FTPPassword'

# Specify the type of Norfolk landscape (e.g., rural, coastal, urban)
landscape_type = "rural Norfolk landscape"  # Change this as per your preference

# Create the image prompt
image_prompt = (
    f"A photorealistic single, cohesive scene image of a {landscape_type}, showcasing the following weather conditions: {today}. "
    "The image should realistically depict elements like cloud formations, sunlight or lack thereof, any precipitation, and wind effects. "
    "It should convey the atmosphere and mood suggested by the weather, with appropriate lighting and color tones. No numerical data or text should be included, just a pure visual representation of the weather in the landscape."
)

# Generate an image using OpenAI's DALL·E
def generate_image(prompt):
    response = client.images.generate(prompt=prompt, n=1, model="dall-e-3", quality="standard", style="vivid", size="1792x1024")
    image_url = response.data[0].url
    return image_url

# Function to generate a datestamp
def get_datestamp():
    return datetime.now().strftime("%Y%m%d%H%M%S")

# Modified FTP upload function
def upload_to_ftp(image_url, remote_path):
    with ftplib.FTP(ftp_server) as ftp:
        ftp.login(user=ftp_username, passwd=ftp_password)
        response = requests.get(image_url)
        image = Image.open(io.BytesIO(response.content))
        datestamp = get_datestamp()
        original_image = io.BytesIO()
        image.save(original_image, format='JPEG')
        original_image.seek(0)
        ftp.storbinary(f'STOR {remote_path}_{datestamp}.jpeg', original_image)
        resized_image = image.resize((1792, 1024))
        jpeg_image = io.BytesIO()
        resized_image.save(jpeg_image, format='JPEG')
        jpeg_image.seek(0)
        ftp.storbinary('STOR public_html/image.jpeg', jpeg_image)
        resized_image = image.resize((800, 480))
        jpeg_image = io.BytesIO()
        resized_image.save(jpeg_image, format='JPEG')
        jpeg_image.seek(0)
        ftp.storbinary('STOR public_html/image_eink.jpeg', jpeg_image)

# Generate the image and upload it
image_url = generate_image(image_prompt)
upload_to_ftp(image_url, 'public_html/image.jpeg')

Breaking down the steps in the code –

  1. Importing Libraries: We start by importing necessary Python libraries for HTTP requests, image processing, FTP interaction, and data parsing.
  2. Fetching Weather Data: The script retrieves weather data from the Met Office using an API key. It extracts relevant information using BeautifulSoup and cleans up the output to get the weather forecast for today.
  3. OpenAI API Key: The OpenAI API key is set up to use the DALL·E model for image generation.
  4. FTP Server Details: FTP server credentials (server address, username, and password) are provided for image uploads.
  5. Weather Details and Landscape Type: The weather description obtained earlier is stored in weather_details . A landscape type (e.g., “rural Norfolk landscape”) is specified.
  6. Image Prompt Creation: The image_prompt  is constructed by combining weather details and landscape type. It describes the desired image.
  7. Image Generation with DALL·E: The  generatrate_image function uses DALL·E to create and return an image based on the prompt.
  8. Datestamp Generation: A datestamp is generated for archiving purposes.
  9. FTP Image Upload: The upload_to_ftp function connects to the FTP server, downloads the generated image, and uploads it to specific directories – this is optional, only of use if you are hosting your images.
  10. Running the Script: We run the script every 12 hours, using a cron job on a Raspberry Pi. We additional send it to our iPhone and our FrameTV, so the latest image is viewable either as a widget or on screen

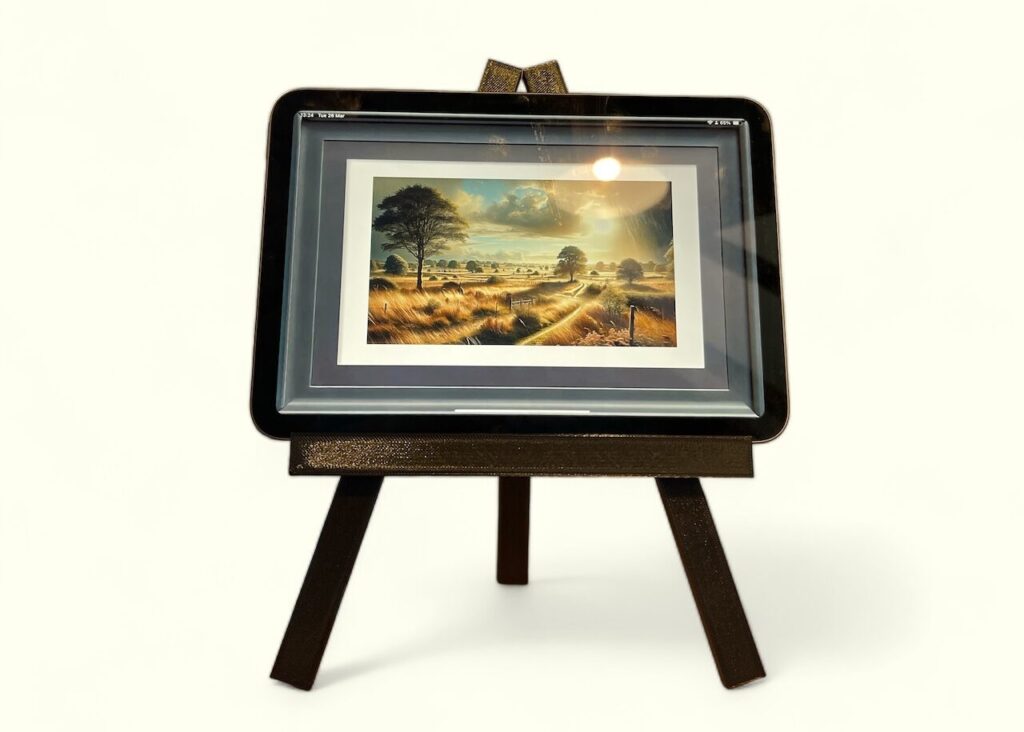
Finally we also display it on our iPad, using the FrameIT app – this auto updates the image when a new one is uploaded to the web server.


Dall-E 3 image on an iPad using Frame-IT

Dall-E 3 image on an iPad using Frame-IT

Do let us know if you create you own AI based weather images using data inputs – it would be interesting to see how different landscapes and counties compare.

Tellus Mater: An AI That Thinks it’s Mother Earth

By Art, Blog, Engagement, Making

Artificial Intelligence is on everyone’s minds, and so is the human-induced environmental decline of our planet Earth.

Tellus Mater Installation

The Connected Environments team, as part of The Bartlett Centre for Advanced Spatial Analysis (CASA), invites you to come and consider both through a new interactive installation developed in response to Gaia, by Luke Jerram, featuring an AI interface that thinks it is the spirit of the Earth itself.

This installation extends the enduring concept of Mother Earth through recent developments in natural language processing and artificial intelligence, allowing you to talk to Mother Earth. Trained on over 300 billion words, Tellus Mater uses a large language model to converse and generate answers to questions about the planet, ecology and imagined futures based on data available up to September 2021.

Tellus Mater ChatGPT Interface

Tellus Mater ChatGPT Interface

A new moving image work offers an artistic response to the AI language model. Integrating fragments of text generated through hours of conversational interaction with archival images of botanical gardens, the video loop (below) invites reflections on the generative potential and limitations of the technology as a form of collective expression and medium for dreaming up alternative future worlds.

All text input and answers are logged as part of an ongoing series of Internet of Things-related research projects developed in CASA into conversations with objects in our built and natural environment.

Tellus Mater has been in place for a month, and so far, it has produced 55, 944 words of conversation, equating to 106 pages of A4. Conversations have been wide and varied, ranging from asking Gaia what her favourite country is (she does not have a preference) through to the meaning of life (a deeply personal and individual quest – it may involve exploring one’s values, finding fulfilment in meaningful relationships and experiences, seeking knowledge and wisdom, or connecting with something greater than oneself) and onwards to why people dislike rain (its important to remember rain is essential for maintaining life on earth).

Created as an art installation, the movie runs alongside the interface, intercutting text generated through hours of conversation with Mother Earth and archival images of botanical gardens; the video loop explores different forms of world-making and imagining.

The work was created by Professor Andrew Hudson-Smith and Dr Leah Lovett of the Connected Environments Lab, UCL EAST, as part of The Bartlett Centre for Advanced Spatial Analysis and was kindly supported by the UCL East Engagement team. It will be on show at Marshgate until the end of the year.

How to Make a Lightsaber Realtime Wind Speed Gauge

By Making, Open Gauges

Imagine wielding the power of the Force, not to fight Sith Lords, but to display real-time data – in our case, wind speed, but the code/build can be adapted to any data feed. Using a NeoPixel strip inside a lightsaber tube, we can create a stunning visual representation of wind speeds. In this post, we’ll look at the build and dive into the code and the concept, helping you turn a lightsaber blade into a unique data meter. The build is part of the ongoing Open Gauges Project, which provides code and 3D print files to build several open-source data gauges.

Why a Lightsaber?

LightSaber Data Tube

LightSaber Data Tube

Aside from it being just plain cool, the lightsaber’s blade offers a perfect medium for light diffusion. This means that each individual LED’s light on the NeoPixel strip spreads out, blending smoothly with its neighbours, ensuring that the entire saber glows uniformly. This makes it easier to visualise and read the data as the light is distributed evenly across the length of the lightsaber.

Whether you’re a Star Wars fan, a weather enthusiast, or just someone looking for a cool project, this NeoPixel Lightsaber wind meter offers a fun and educational experience. May the winds be with you!

The Hardware

The main tube comprises a 1″ OD Thin Walled Trans White Polycarbonate Blade Tube with a one-metre-long Foam Diffuser Tube to add to the diffusion level. The diffuser tube is also wrapped in a length of Blade Diffusion Film. All of these are sourced from the excellent https://thesaberarmory.com/ in the UK.

Plasma Stick 2040W

Plasma Stick 2040W

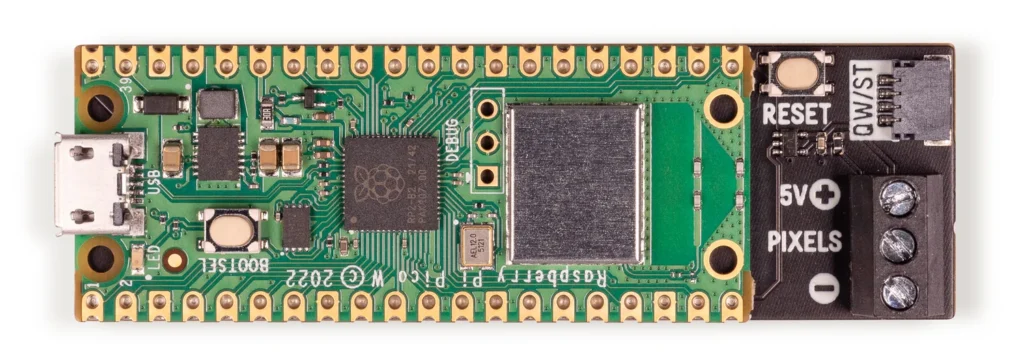
We put a standard 144 WS2812b Neopixels inside the foam tube in a one-metre strip. This is subsequently wrapped in the Blade Diffusion Film, which fits inside the Polycarbonate Tube. This is how most lightsabers are made; a strip of Neopixels inside a diffuser to make for smooth fluorescent-like lighting inside the tube. To power it, we use a Pi PicoW. Any Pi Pico will do, but Pimoroni makes one precisely for Neopixels, the Plasma Stick 2040W PicoW Aboard.

The lightsaber tube is mounted onto a 1.25-metre length of timber using a top and bottom end mount, which are 3D printed; all the 3D printed files are available in the GitHub Repository. The bottom part is a holder for both the Light Saber tube and the PicoW, with a screw on the bottom lid allowing easy access to the wiring.

Lightsaber Data Tube Holder - Fusion 360

Lightsaber Data Tube Holder – Fusion 360

The following YouTube clip from the Saber Armory provides an excellent guide to assembling the sabre. We use a flexible neopixel strip and, of course, different mounts, but the build is similar:


The NeoPixels

NeoPixels are individually addressable RGB LEDs. These are LEDs where you can control the colour and brightness of each individual light diode on the strip. With a long strip of these LEDs inside a lightsaber tube, we can represent wind speeds by lighting up different portions of the strip in varying colours.

How Do We Represent Wind Speed?

We divide the range of possible wind speeds into sections. In our code example, these sections are represented by colors:

  • 0 to 10: BLUE (Low winds)
  • 10 to 20: GREEN (Fresh winds)
  • 20 to 30: YELLOW (Moderate winds)
  • 30 to 40: ORANGE (Strong winds)
  • Above 40: RED (Above Gale Force)

As the wind speed increases, more of the strip lights up, moving through the colors as it progresses. Additionally, the highest wind speed measured is indicated with a RED pixel, serving as a max wind marker. This resets at midnight and provides an at-a-glance view of the maximum wind gust for the day.

Let’s Dive into the Code

All the files required are available in the GitHub Repository. We have aimed to make it as simple as possible to understand and edit. As such, we break down the code below. If you want to, you can simply copy across all the files from our GitHub to your PiPicoW, edit the config file for your wifi and our example should happily work. However, if you want to know more about the workings –

The heart of our project is the NeoPixel library and the MQTT protocol to receive wind speed data (we explore this in more depth below). We use MQTT as it allows real-time data to be effectively streamed to the Lightsaber blade. It also means the data can be swapped for other feeds as needs be, such as Air Pressure, Air Quality, Temperature etc – indeed any numerical data stream you can find. Our MQTT stream is provided by a Davis Vantage Pro 2 via Weewx on a Raspberry Pi which outputs the MQTT stream.

First, we set up the NeoPixel strip:

python
from neopixel import Neopixel 

# Set up NeoPixels numpix = 144 pixels = Neopixel(numpix, 0, 15, "GRB") pixels.brightness(255)
We have 144 LEDs on our strip. We initialize it and set its brightness to maximum.

Next, we define our wind speed ranges and corresponding colors – this can be edited according to the wind speed range you want to use.

colors = {
    'BLUE': (0, 0, 255),
    'GREEN': (0, 255, 0),
    ...
}

WIND_SPEED_RANGE = [0, 60]
multiplier = numpix / (WIND_SPEED_RANGE[1] - WIND_SPEED_RANGE[0])


The update_pixels function is the heart of the color-mapping logic. It translates wind speed values into color changes on the NeoPixel strip:
  • A gentle breeze is shown in blue, indicative of calm weather.
  • As the wind picks up, the colors transition to green, a universal symbol of ‘go’ or safety.
  • When winds grow stronger, the color shifts to yellow, suggesting caution.
  • Higher wind speeds are shown in orange, and finally,
  • Potentially dangerous wind speeds are indicated with red, universally associated with warnings and danger.

This gradual change of colors not only represents the data but also provides an intuitive sense of the wind’s intensity.

Dynamic Updates

The script dynamically updates the NeoPixel colors as the wind speed changes. By using a threshold, minor fluctuations are filtered out preventing the display from changing too frequently and thus improving the readability of the data. Only significant changes in wind speed result in a color change, ensuring a clear and comprehensible visual output.

Tracking the Peak Wind Speed

The script utilizes global variables to keep track of the current maximum wind speed (max_wind) and the previous maximum  (prev_max_wind). The function sub_cb updates these values as new wind speed messages are received via MQTT (we explore MQTT more in the next step):

if wind > max_wind:
    max_wind = int(wind)

This simple logic ensures that only the highest wind speed is showcased as the maximum.

Visualizing the Maximum Wind Speed

The maximum wind speed is visualized distinctly by coloring a specific NeoPixel in red. This is handled in the set_pixel_colour function:

pixels[max_wind] = colors['RED']  # Update max_wind pixel

This code assigns the ‘RED’ color from the colors dictionary to the pixel at the index corresponding to the maximum wind speed. This red marker provides an immediate visual indicator of the peak intensity of the wind speed for the current observation period.

Dynamic Updates and Resets

As the wind speed changes, the script continuously updates the display. If a new maximum is detected, it changes the appropriate pixel to red, and the previous maximum pixel reverts to its color that corresponds to its wind speed range. This dynamic updating gives real-time feedback about the wind’s behavior.

Furthermore, the script includes a scheduled reset at midnight:

if current_time[3] == 0 and current_time[4] == 0:  # Check if hour and minute are both 0
    machine.reset()

Understanding MQTT in Our NeoPixel Lightsaber

MQTT, which stands for Message Queuing Telemetry Transport, is a lightweight messaging protocol designed for low-bandwidth, high-latency, or unreliable networks. It’s become the de facto standard for IoT devices due to its simplicity and effectiveness. In our project, we use MQTT to receive wind speed data which then drives the NeoPixel display.

How MQTT Works

At a high level, MQTT operates over a publish/subscribe model:

  1. Broker: A central server that receives messages from publishers (devices or applications that produce data) and routes them to subscribers (devices or applications that consume data). The broker manages active clients and topics.
  2. Topic: Think of it as a “channel” where data is published. Clients can subscribe to topics or publish data to them.
  3. Message: The data or information sent from the publisher to the subscriber.

Implementing MQTT in our Lightsaber

In our code, the MQTT protocol is implemented using the excellent mqtt_as library.

Setting up our MQTT client:

from mqtt_as import MQTTClient, config

# Define configuration
config['subs_cb'] = sub_cb
config['wifi_coro'] = wifi_han
config['connect_coro'] = conn_han
config['clean'] = True

# Set up client
MQTTClient.DEBUG = True  
client = MQTTClient(config)

Subscribing to a topic – our topic provides wind speed data every 3 seconds. You can leave this topic in to test your system works, and then replace it with your own data, or any other data source.

async def conn_han(client):
    await client.subscribe('personal/ucfnaps/downhamweather/windSpeed_mph', 1)

When a message is published to this topic, our sub_cb function is triggered.

Processing Received Data

def sub_cb(topic, msg, retained):
    ...
    wind_speed = float(msg)
    ...

We convert the received message into a number, which represents our wind speed. Depending on the wind speed value, the corresponding section of the NeoPixel strip is illuminated.

The main logic for setting the color of the pixels based on the wind speed is in the set_pixel_color function. This function checks if the wind speed has increased or decreased since the last measurement and updates the lightsaber’s glow accordingly.

The full code is below:

from neopixel import Neopixel
from mqtt_as import MQTTClient, config
from config import wifi_led, blue_led
import uasyncio as asyncio
import machine
import ntptime
import time

# Set up NeoPixels
numpix = 144
pixels = Neopixel(numpix, 0, 15, "GRB")

colors = {
    'BLUE': (0, 0, 255),
    'GREEN': (0, 255, 0),
    'YELLOW': (255, 100, 0),
    'ORANGE': (255, 50, 0),
    'RED': (255, 0, 0),
    'OFF': (0, 0, 0)
}

pixels.brightness(255)
prev_wind = 0
prev_max_wind = 0
max_wind = 0  # Initialize max_wind

WIND_SPEED_RANGE = [0, 60] #actual is half this amount to allow the max wind marker virtually
multiplier = numpix / (WIND_SPEED_RANGE[1] - WIND_SPEED_RANGE[0])

UPDATE_THRESHOLD = 2  # Only update if wind speed changes by 2 or more

def set_pixel_color(wind, max_wind):
    global prev_wind
    
    if abs(wind - prev_wind) < UPDATE_THRESHOLD:
        return

    while prev_wind < wind:
        update_pixels(prev_wind)
        time.sleep(0.05)
        prev_wind += 1

    while prev_wind > wind:
        update_pixels(prev_wind)
        time.sleep(0.05)
        prev_wind -= 1

    pixels[max_wind] = colors['RED']  # Update max_wind pixel

    pixels.show()


def update_pixels(wind_value):
    for i in range(1, numpix):
        if i <= wind_value < numpix:
            if i <= 20:
                color = colors['BLUE']
            elif i <= 40:
                color = colors['GREEN']
            elif i <= 80:
                color = colors['YELLOW']
            elif i <= 100:
                color = colors['ORANGE']
            else:
                color = colors['RED']
            pixels[i] = color
        elif i == max_wind:  # Use max_wind directly
            pixels[i] = colors['RED']
        else:
            pixels[i] = colors['OFF']
    pixels.show()

def sub_cb(topic, msg, retained):
    global max_wind, prev_max_wind

    print(f'Topic: "{topic.decode()}" Message: "{msg.decode()}" Retained: {retained}')
    wind_speed = int(msg)

    if WIND_SPEED_RANGE[0] <= wind_speed <= WIND_SPEED_RANGE[1]:
        wind = (wind_speed - WIND_SPEED_RANGE[0]) * multiplier

        if wind > max_wind:
            max_wind = int(wind)

        if max_wind != prev_max_wind:  # Check if max_wind has changed
            print("Max Wind", max_wind)
            prev_max_wind = max_wind

        set_pixel_color(wind, max_wind)
    else:
        for i in range(numpix):
            pixels[i] = colors['OFF']
        pixels.show()


async def get_current_minute():
    try:
        ntptime.settime()  
        current_time = time.localtime()
        return current_time[4]  
    except:
        print("Could not get the time from the internet")
        return None

#Reset Wind Max and System at Midnight
async def reset_on_hour(): 
    while True:
        try:
            ntptime.settime()  # Get the current time from the internet
            current_time = time.localtime()
            if current_time[3] == 0 and current_time[4] == 0:  # Check if hour and minute are both 0
                machine.reset()
            else:
                await asyncio.sleep(60 - current_time[5])
        except:
            print("Could not get the time from the internet")
            await asyncio.sleep(60)  # Retry after 1 minute if time sync fails


async def heartbeat():
    s = True
    while True:
        await asyncio.sleep_ms(500)
        blue_led(s)
        s = not s

async def wifi_han(state):
    wifi_led(not state)
    print('Wifi is ', 'up' if state else 'down')
    await asyncio.sleep(1)
    if state:
        asyncio.create_task(reset_on_hour())  # Start reset_on_hour task after WiFi is connected

async def conn_han(client):
     # await client.subscribe('personal/ucfnaps/saber/config/', 1)
       await client.subscribe('personal/ucfnaps/downhamweather/windSpeed_mph', 1)

async def main(client):
    try:
        await client.connect()  # Ensure WiFi and MQTT connection before starting other tasks
    except OSError:
        print('Connection failed.')
        return
    
    n = 0
    while True:
        await asyncio.sleep(5)
        n += 1

# Define configuration
config['subs_cb'] = sub_cb
config['wifi_coro'] = wifi_han
config['connect_coro'] = conn_han
config['clean'] = True

# Set up client
MQTTClient.DEBUG = True  
client = MQTTClient(config)

asyncio.create_task(heartbeat())

try:
    asyncio.run(main(client))
finally:
    client.close()  
    asyncio.new_event_loop()

Bringing it All Together

We also provide two wall mounts which screw onto the back of the backing wood. This provides spacing so the Lightsaber Wind Gauge has a space off the wall as well as a hook for a standard nail or screw. The wood was dyed with Dark Oak wood stain and the wind speed indicators (text and numbers) were glued at the corresponding lengths along the lightsaber blade.

LightSaber Data Tube - Fusion360

LightSaber Data Tube – Fusion360

To effectively space the numbers/text we changed the MQTT feed away from the realtime feed to a feed we can send data to (/saber/config). This allowed us to send the value from 5 to 60 and light up the tube, allowing us to visually see where the text/numbers are glued.

That completes the build, with the combination of the NeoPixel strip, MQTT for data transmission, and the aesthetic appeal of a lightsaber. We hope you agree that it makes for a unique and visually pleasing method to measure and display wind speed.

Close Menu

About Salient

The Castle
Unit 345
2500 Castle Dr
Manhattan, NY

T: +216 (0)40 3629 4753
E: hello@themenectar.com

Archives