Last Friday (April 20th) over 350 members of the public attended our Smart Cities ‘Bridging Physical and Digital’ open day and conference at Senate House, London. The full day of talks, accompanied by the Smart Cities exhibition, was aimed at opening a discussion on the meaning behind the Smart City and, perhaps more importantly, how to make it a reality.
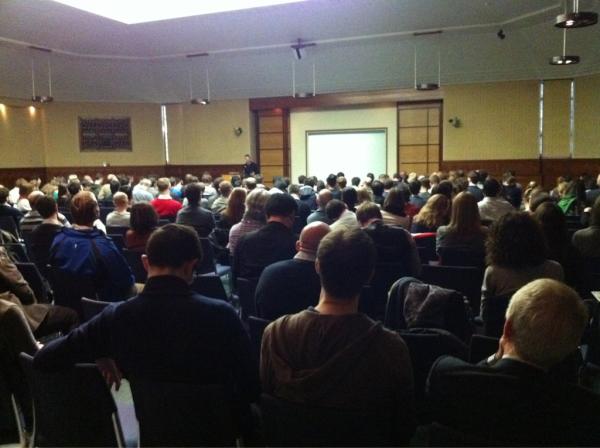
Four articles covering the day’s highlights and research announcements appeared in Wired with a further two in New Scientist, helping to make the event one of the most successful in the history of CASA. Professor Michael Batty kicked off the day with the dynamics of urban places and how key technological developments can be used to gain an insight into the wider science of cities. Carlo Ratti, Director of MIT’s Senseable City Lab continued the theme with a keynote address, mixing computer science with architecture, art and design to envisage the digital city across a multitude of platforms. Jon Reades was the first researcher whose work was picked up by Wired with a view on how data could be the solution to London’s stretched transport networks.
As Duncan Geere of Wired noted: “Reades is working on taking data from Transport for London and using it to draw out information that can be used to better-inform decisions about what parts of the network need to be tweaked for maximum impact. Some of the early results are already intriguing. A large proportion of commuting journeys aren’t symmetrical — they don’t go to and from the same places. While in the mornings, people tend to travel straight to work in the quickest way possible, in the evenings they tend to stop off at a pub, or to see a friend and take a more circuitous route, reducing demand.” With the first three talks complete the exhibition opened, showcasing a wide range of digital research from CASA presented in a physical from. As New Scientist asked: “have you ever looked at a pigeon and wished you could experience life through its beady eyes? Well now you can, thanks to the Pigeon Simulator – created as a new way to visualise the cities and its data feeds.”
Data can be visualized in a myriad of ways, yet sometimes it is the simplest that are the most effective. The London Data Table cycled through a series of visualisations from live aircraft feeds through to data from the Barclays Cycle Hire Scheme to present a view of London from above.

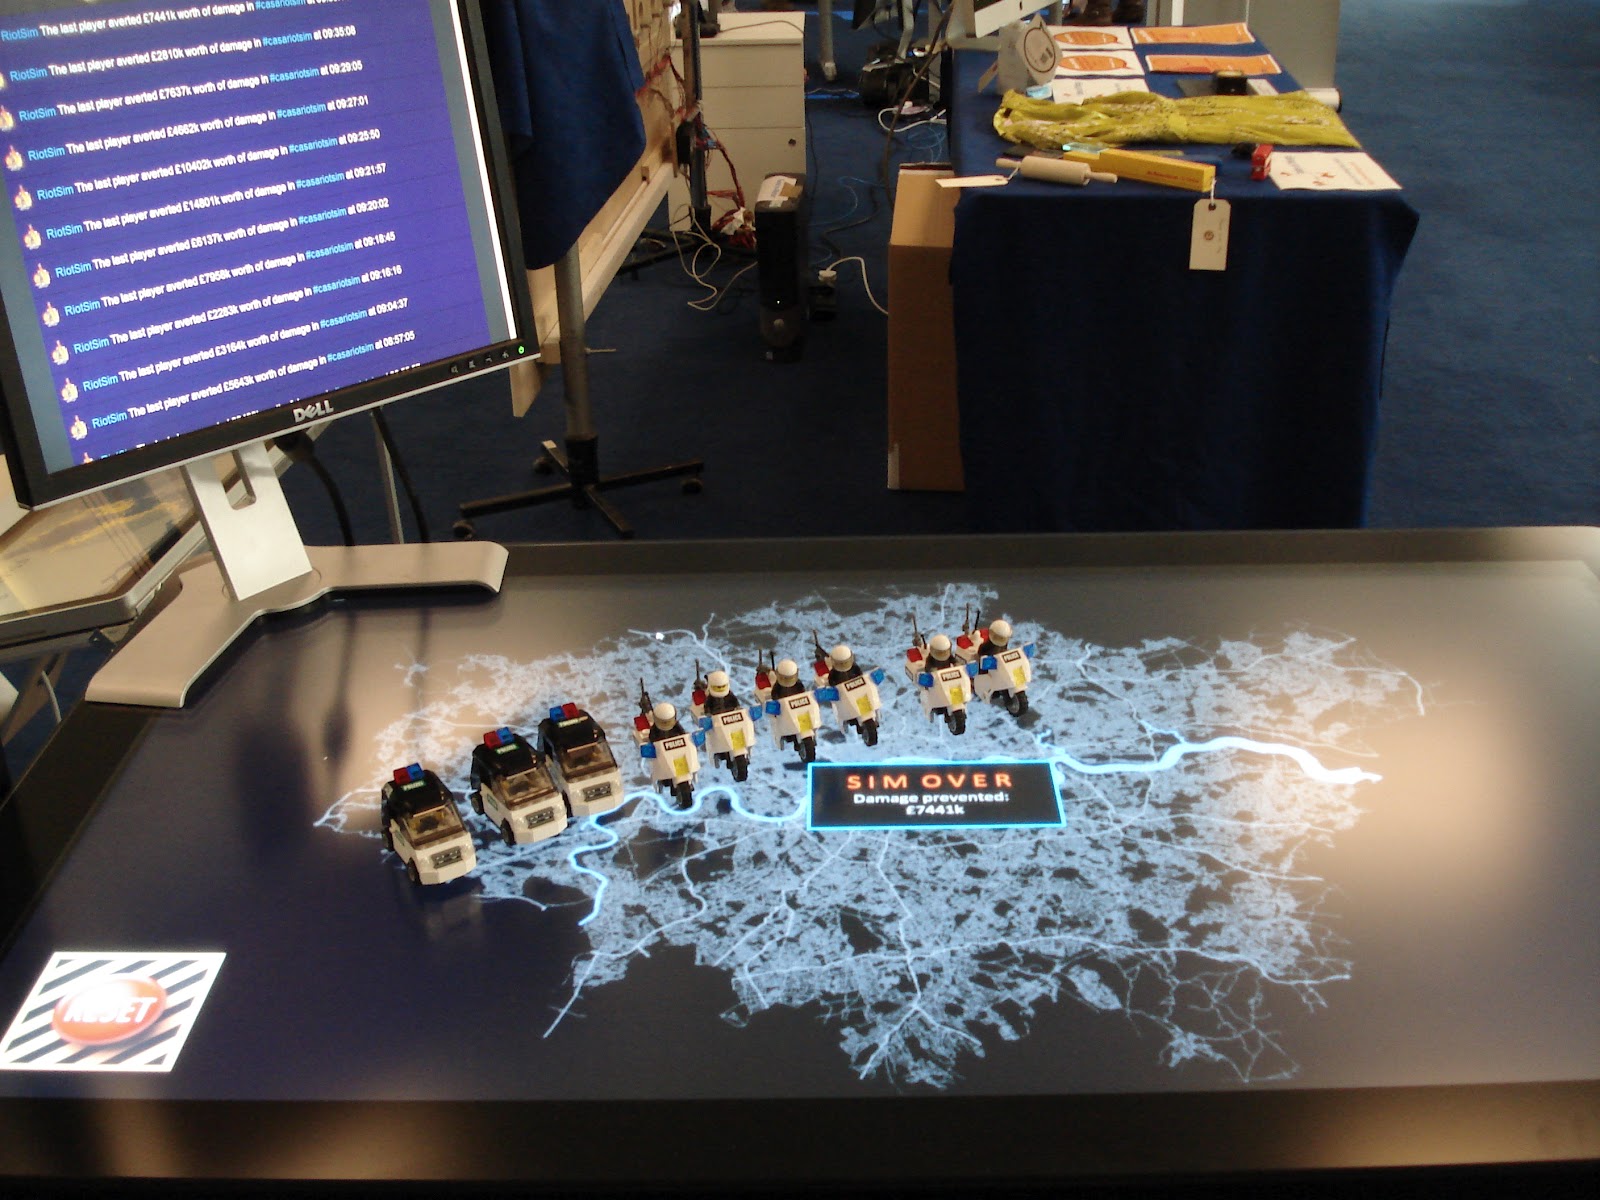
Combining a projector with a short throw lens, a table cut to the outline of London and various processing scripts and movies allowed an instant view of complex data feeds. Another highlight was the touch table enabled ‘Riot Simulator’ mixing data from the recent London riots with research into urban and behavioral modeling made hands on with the help of Lego. The concept behind the riot table was the focus of Sir Alan Wilson’s talk in the second part of the conference with modeling suggesting that an earlier police response could have shortened the London riots. As reported in a second article in Wired, we are within sight of being able to model this kind of event, and optimal police response.
James Cheshire and Martin Zaltz Austwick focused on the visualisation of global bike hire schemes. China, perhaps unsurprisingly, has some of the largest cycle hire schemes in the world. The patterns hidden in the datasets can be the key to understanding a variety of aspects of the cities. These hidden patterns can be linked to our overall level of happiness in places as it varies throughout the city. George MacKerron examined aspects of happiness in his talk linking in location via the ‘Mappiness’ iPhone application. In the third Wired write up of the day George notes that the results of Mappiness pinpoint coasts as the place where people are happiest, followed by mountains, moors, woodland and grassland. Urban areas come right at the bottom of the list. Location is arguably central to the concept of Smart Cities.
Andrew Hudson-Smith focused on the Internet of Things but more specifically the Internet of Second Hand Things and tracking the Geography of Everything. Via a partnership with Oxfam earlier trials are taking place to tag and track second hand goods. Smart cities start with the fabric that creates place, the objects around us. From the view of a hyper-local-social system with bus stops that tweet up the views of a connected urban realm, the Internet of Things is central to making places and spaces smart. Finally in a full day of talks Duncan Smith and Ollie O’Brien presented and launched a beta version of CityDashboard. CityDashBoard aggregates simple spatial data for cities in the UK and displays the feeds on a dashboard and map. Funded by JISC as part of the NeISS project the data feeds are diverse from real-time weather through to a background radiation count.

The day rounded off with a panel session consisting of Mike, Carlo, Alan and Andy, chaired by James and recorded for a forthcoming GlobalLab podcast. Finally the wine reception allowed a final opportunity to visit the exhibits, from the Xbox tube simulation through to Pigeon Sim, RFID powered Internet of Things demos and another outing for the Tweet-o-Meter. It was a day of sensors, tracking, mapping, visualising, modeling and making which represented the diverse mix of research that goes on at the Centre for Advanced Spatial Analysis, all with a common theme of cities and making places, and tho
se organizations that plan them, smart…
