As reported on today’s BBC Technology, Oxfam has launched its new Shelflife system linking goods with the past using QRCodes.
Ever wished an object could tell its story? That’s the idea behind Oxfam’s unique pilot scheme, Oxfam Shelflife. Powered and based on the idea behind Tales of Things, the Oxfam Shelflife app uses QR codes to enable the public to discover the stories behind Oxfam’s donated, ethical and Unwrapped products, and even share their own stories for the items they donate.
Ever wished an object could tell its story? That’s the idea behind Oxfam’s unique pilot scheme, Oxfam Shelflife. Powered and based on the idea behind Tales of Things, the Oxfam Shelflife app uses QR codes to enable the public to discover the stories behind Oxfam’s donated, ethical and Unwrapped products, and even share their own stories for the items they donate.

The project is the latest innovation from Oxfam which promotes sustainability by encouraging people to look beyond disposable consumerism. The stories behind vintage and second-hand items are all part of their desirability. At the moment these stories can be lost when an item is acquired by a new owner but Oxfam Shelflife enables the stories to stay with the items in a more long-lasting way.
Oxfam’s Sarah Farquhar, Head of Retail Brand said: “Every item has a story to tell and Oxfam Shelflife enables people to share these stories. We’ve found that items with an interesting story behind them are instantly more appealing to our customers so we hope Oxfam Shelflife will encourage people to love items for longer. This commitment to sustainability is an important part of what Oxfam shops bring to the high street.”
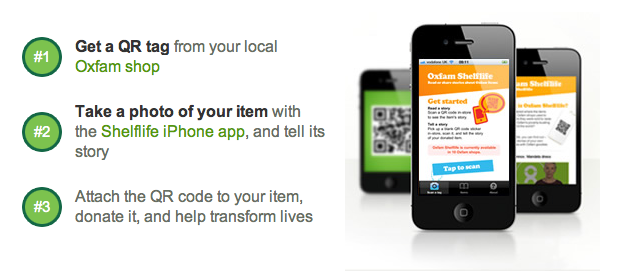
The scheme allows donors to ‘tag’ a QR code to their donated object, using the free Oxfam Shelflife app on their iPhone and share the story behind the item for the next owner to discover.Shoppers who visit the participating Oxfam stores can then scan the QR code on the item, via the app, which will take them to the unique story behind the object. Usually QR codes direct users to a website or URL but the Oxfam Shelflife app enables users to engage and interact with the technology, taking QR codes on to a new level.

The concept behind Oxfam Shelflife is based on an original idea developed by the Tales of Things initiative (TOTeM: Tales of Things and Electronic Memory), a collaboration between five British universities: University College London, The University of Edinburgh/Edinburgh College of Art, Brunel University, the University of Dundee and the University of Salford. The TOTeM initiative was funded by a £1.4m grant from the Engineering and Physical Sciences Research Council.
How does it work? Take a look at the Oxfam Shelflife intro:
How does it work? Take a look at the Oxfam Shelflife intro:
It is hard to put into the words the pride we have in the project, from an idea and technology born in a research Sandpit funded by the Digital Economy Research Councils UK through to a refined and redesigned concept running in Oxfam Shops. The whole system went through a complete series of user testing and design stages to produce an app and system as simple as possible while still building on the concept of read/write Internet of Things tagging. Oxfam now has its first every smart phone app and its based on the Internet of Things, making every shop a social museum. Although the best part is helping Oxfam in its mission to help transform lives via attaching stories and memories to second hand goods.
We will have more on Shelflife in coming days/weeks as well a news on a new ‘Powered by Tales of Things’ site coming soon, created via the new API.
Head over to http://shelflife.oxfam.org.uk/ to view some of the hundreds of objects donated with stories.
We will have more on Shelflife in coming days/weeks as well a news on a new ‘Powered by Tales of Things’ site coming soon, created via the new API.
Head over to http://shelflife.oxfam.org.uk/ to view some of the hundreds of objects donated with stories.