Finally a Post – An Update on Digital Urban

By Posts No Comments

Firstly apologies, the blog has been sat on the sidelines waiting for a post while i have been in a whirlwind of a three weeks. The good news is the blog is back, in short, we have been in the process recently of securing grants, launching a new Masters of Research course here at the Centre for Advanced Spatial Analysis at University College London and presenting current research to the British Science Festival and the associated press conference.

Press Conferences are everything you imagined with the various leading newspapers gathering round and shouting questions. Packing a dress worn by Annie Lennox at Nelson Mandela’s Birthday Party, RFID tags and a short presentation based around the Tales of Things work we announced the concept of the Internet of Second Hand Things.

It was a fun event and we had some excellent coverage with the Financial Times, Sunday Times, Russia Channel One, BBC Radio 4 and BBC Radio 5 amongst the highlights. Mixed into this were two grant bids, one with NESTA and the other for a UCL Enterprise Award. I’m please to say we won them both, opening the doors to work with the Imperial War Museum and Digital Humanities in UCL and continuing the work with the wider TOTeM group to set up TOTeM Labs.
While juggling press requests, conference presentations, grant short listings and interview boards we have welcomed 9 members to our new MRes in Advanced Spatial Analysis and Visualisation – a Masters of Research differs from a traditional MSc as its less jumping through hoops to learn and more focused in becoming part of the research world. We purposely constructed the MRes to be the course we would like to take and as such it is an exciting mix of visualisation, coding, mapping, crowd sourcing, modelling and research methods. If you are thinking of taking a Masters, i would strongly suggest a MRes, it offers something different to everyone else with a MSc and of course sets you up for a PhD. 
Our email box is horribly behind, my office is a pile of papers and people keep saying i look knackered but its been great and the last three weeks have been about creating impact and hopefully securing research funds to document and share here on the blog via posts and tutorials. Currently i am on a train returning from a two day kick off meeting in  Southampton with the National Centre for Research Methods (NCRM) on another new grant ‘TALISMAN’. Based around crowd sourcing techniques, Big Data and Xbox/Chrome/PC visualisations, TALISMAN runs for the next three years.
Rounding off, our CityDB (dashboard/database) work also starts this month, following on from the JISC funded GEMMA (Geographic Engine for Mass Mapping Applications) which previews in a few weeks time. It aims to provide new live feeds for Smart Cities, but above and beyond the normal traffic/air pollution data. At the moment i have a Geiger Counter on my desk waiting to be plugged in and a 3D Agent Based Modelling world to complete and port to the iPad. Its been a slightly off topic blog post for once but perhaps a small insight into the life of at least one part of the multi disciplinary research lab that is CASA.
Finally, you can  keep up to date with developments either via @digitalurban on Twitter or with the new Global Lab podcast, currently up to episode 6. If you would like to join us in CASA to do research based around spatial, cultural analysis and urban visualisation you can apply for our MRes or a PhD.

QRCodes, Augmented Reality, ARK, Unity and the iPad

By Posts One Comment

Stuart Eve here in CASA has been working away in the Unity gaming engine in terms of Augmented Reality applications for the iPhone and iPad. As Stewart himself notes it is surprisingly successful and with at least 3 different ways of getting 3D content to overlay on the iOS video feed (Qualcomm, StringAR and UART). He has been attempting to load 3D content at runtime, so that dynamic situations can be created as a result of user interaction – rather than having to have all of the resources (3D models, etc.) pre-loaded into the app. This not only saves on file size of the app, it also means that the app can pull real-time information and data that can be changed by many people at once. 

The preliminary results can be seen in the video below, linked to the Archaeological Recording Kit (ARK)
This example uses the Qualcomm AR API, and ARK v1.0. Obviously at the moment it is marker-based AR (or at least image recognition based), the next task is to incorporate the iDevices’ gyroscope to enable the AR experience to continue even when the QR code is not visible.
It is well worth keeping a watch on Stuarts blog for further updates….

Audio Generated Soundscapes

By Posts 2 Comments

We have a bit of a ‘thing’ about 3D audio soundscapes. Over recent years it has become increasingly possible to analyse audio content and visualise it within a 3D package, there are solutions for most suites out there from 3D Max, Cinema 4D and through to Processing.

The ‘audio driven landscape’ below by flight404 is one of the best examples we have seen, written in processing it makes use of the Sonia Sound Library:

We hope to grab some time to dive into this ourselves with a view of determining the ‘Sound of the City’….

From London Datastore to MapTube: Simplifying the Process

By Posts No Comments

Richard Milton here in CASA has released a new feature on the MapTube website today which will make it easier to create new maps from data in CSV files. The new update to MapTube adds a graphical user interface which allows the user to upload a data file, choose a colour scale and publish the map on MapTube directly. As Richard states, one of the driving forces behind this was the idea that creating a map should be simple enough that you could do it using an iPad. Data on the London Datastore  is in the correct format, so you can copy the CSV link directly from the site, which is exactly what has been done in the above image. Richard has created a YouTube clip showing the whole process:

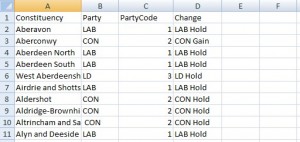
This feature is still experimental, but at the moment it handles point data in lat/lon coordinates (WGS84) or OS coordinates for the UK (OSGB36). Point data can be drawn using markers, or as a heatmap showing point density. For area data, one column in the data is selected as a key field and this is joined with the geographic data stored in MapTube’s database to draw the map. For example, using the following data:
We have four columns: Constituency, Party, PartyCode and Change. In the CSV file the first line must be the column headings, then every subsequent line contains data. The CSV file would contain the following:
Constituency,Party,PartyCode,Change
Aberavon,LAB,1,LAB Hold
Aberconwy,CON,2,CON Gain
etc...
The “Constituency” column is the area key in this case, but MapTube determines this automatically when the CSV file is loaded, along with the type of geography, which is Parliamentary Constituencies. In order to colour the map, numeric data is required, so in this example, a column labelled “PartyCode” has been added where “LAB”=1, “”CON”=2, LD=”3″ etc.
The colour scale is then chosen and the finished map submitted to MapTube where it can be viewed along with any of the other maps. There are help pages accessible through the ‘i’ icon on each section which contain further information.
As mentioned before, this feature is still experimental and we will be gradually adding more geographic data to the MapTube database to allow maps to be built from additional geographies. The aim is for MapTube to be able to automatically detect the geography just by analysing the data and, at the moment, the following geographies can be used:
Government Office Regions (UK) (GOR)
Lower level super output areas (UK) (LSOA)
Medium level super output areas (UK) (MSOA)
Output Areas (UK) (OA)
Postcode Districts (UK) (PostcodeDistricts)
County and Unitary Authority (UK) (CountyUA and ONSCountyUA)
Districts (UK) (Districts and ONSDistricts)
Census Area Wards (UK) (CASWards)
World Borders 2010 (WorldBorders2010ISO2 and ISO3 using the ISO country codes)
Parliamentary Constituencies 2010 (UK) (PCON2010)
US States and Zip code areas will be added shortly, along with administrative and Census boundaries for other parts of the World.

The underlying technology is used on the SurveyMapper site and for other real-time visualisations like http://bigdatatoolkit.org/2011/07/26/1yeartogo/ which shows tweets using the #1yeartogo hashtag for the London 2012 Olympics.


We aim to enhance this further over the coming months as MapTu
be is at the heart of GEMMA (Geographical Engine for Mass Mapping Applications), its an interesting step forward in rapid visualisation from data portals. Thanks as ever go to Richard for his work on MapTube and its every increasing number of users.
Close Menu

About Salient

The Castle
Unit 345
2500 Castle Dr
Manhattan, NY

T: +216 (0)40 3629 4753
E: hello@themenectar.com

Archives