Yesterday a license for CityEngine landed on our desk from the nice people at ESRI and to be honest we were a little too excited for our own good, after all its only software. However, CityEngine and its integration with ESRI ArcGIS, while maintaining full export capabilities to load into 3DMax/Lumion/Unity etc, is a game changer.
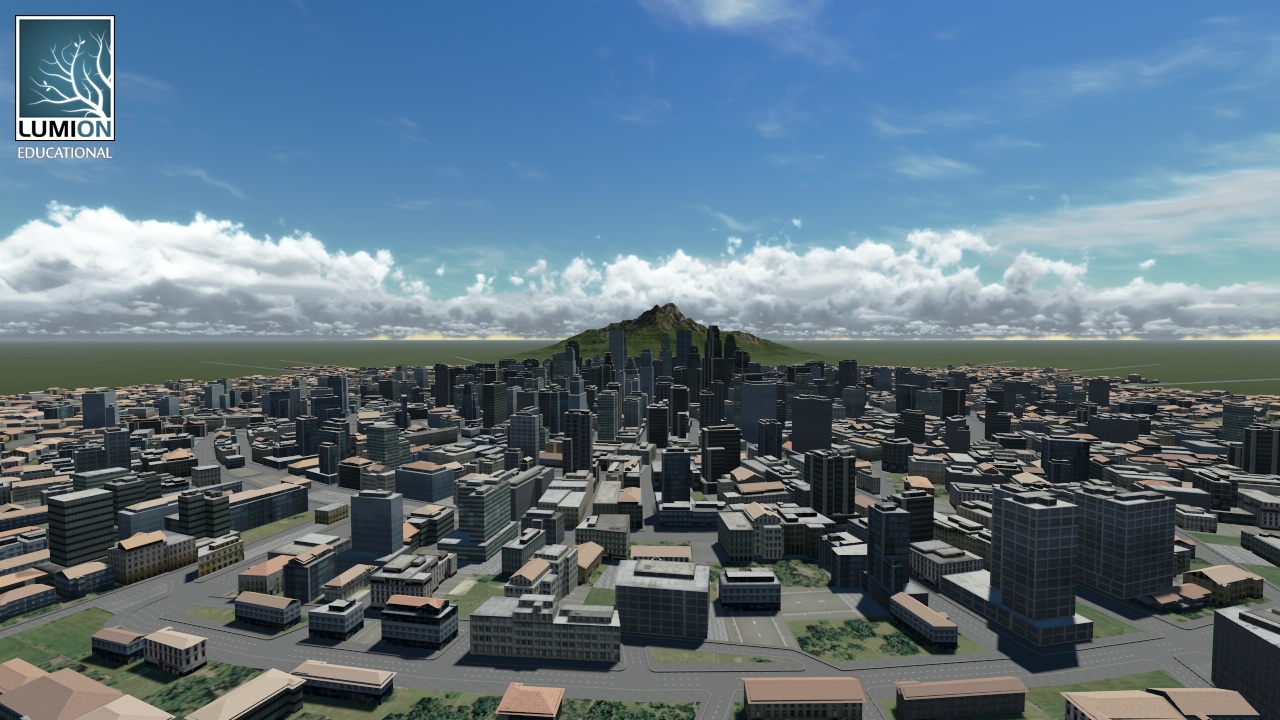
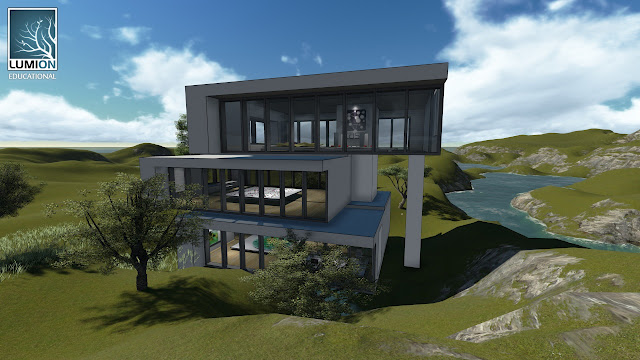
It moves GIS visualisation a step forward while at the same time bringing procedural city modelling into the mainstream game engine world. Over the coming weeks we will be putting the software through its paces and exporting into Max/Lumion and Unity as part of introducing CityEngines onto our MRes in Advanced Spatial Analysis and Visualisation. The clip below details out first output direct from CityEngine into Lumion, adding in a general landscape, sample trees and transport objects:
Linking in our previous post on ArcGIS Twitter Visualisation in Lumion it seems that the worlds of GIS and architectural visualisation/game engines are finally starting to become accessible.