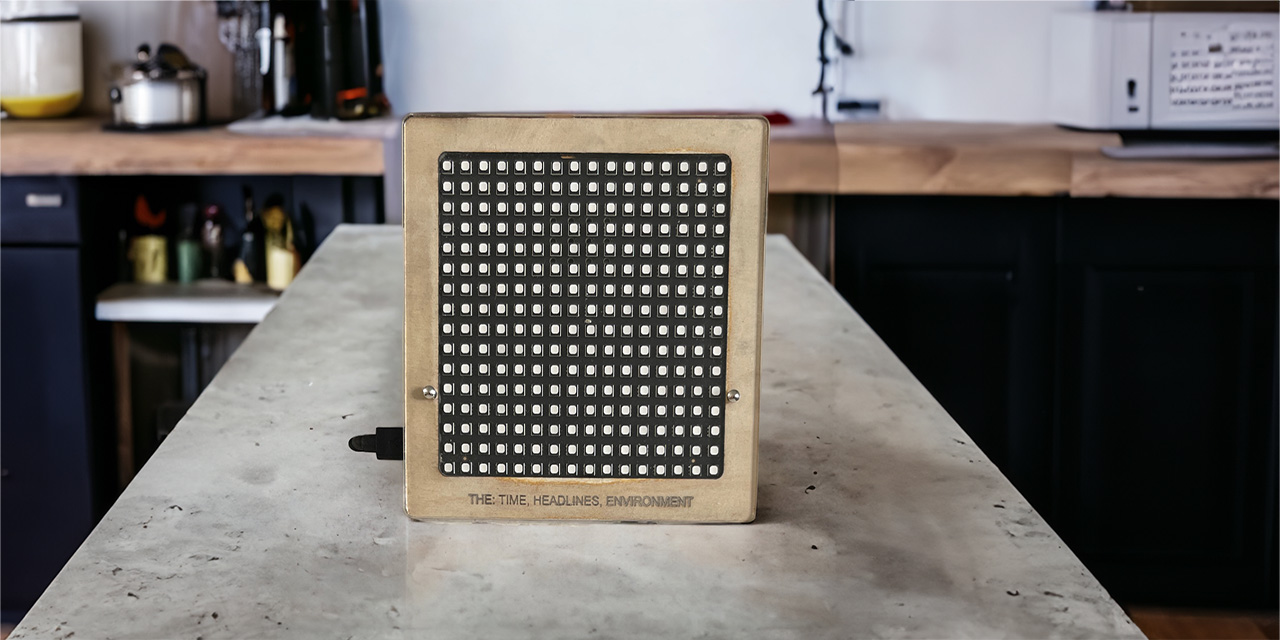
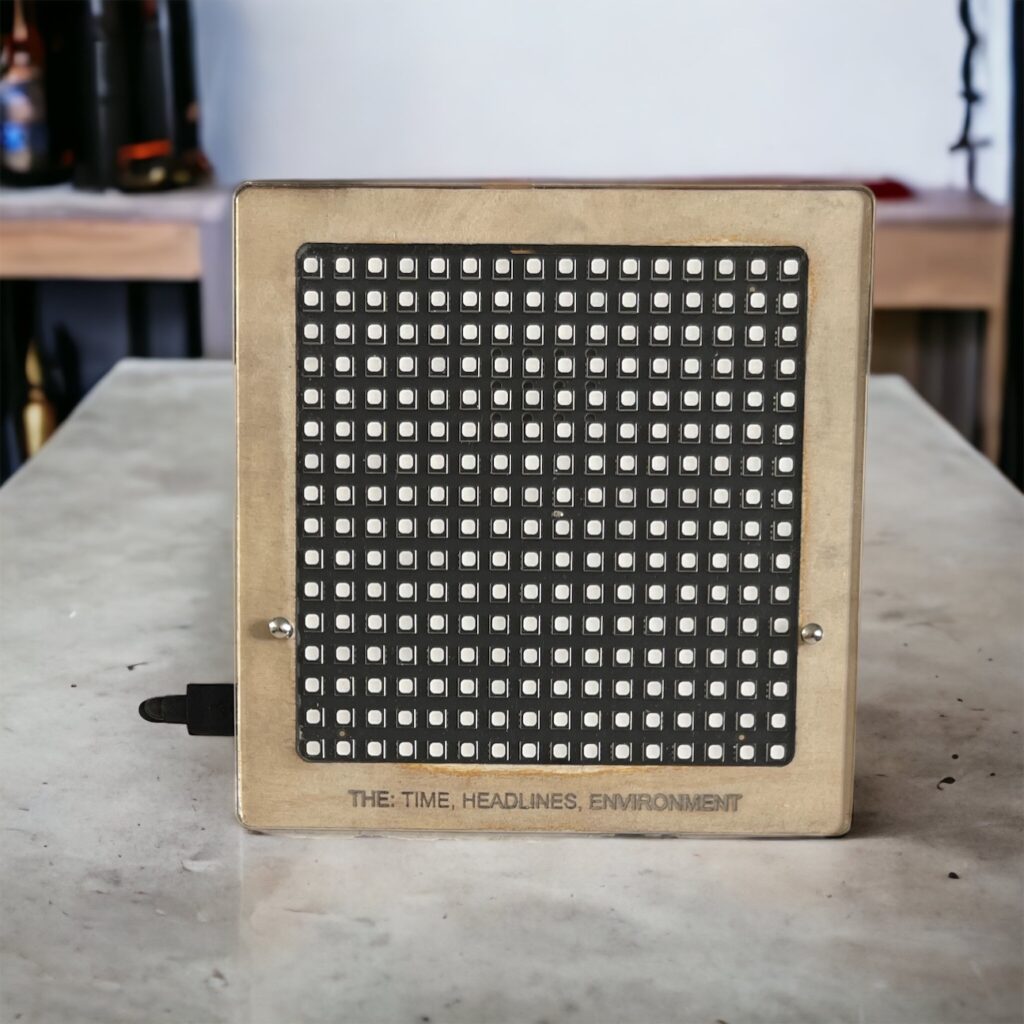
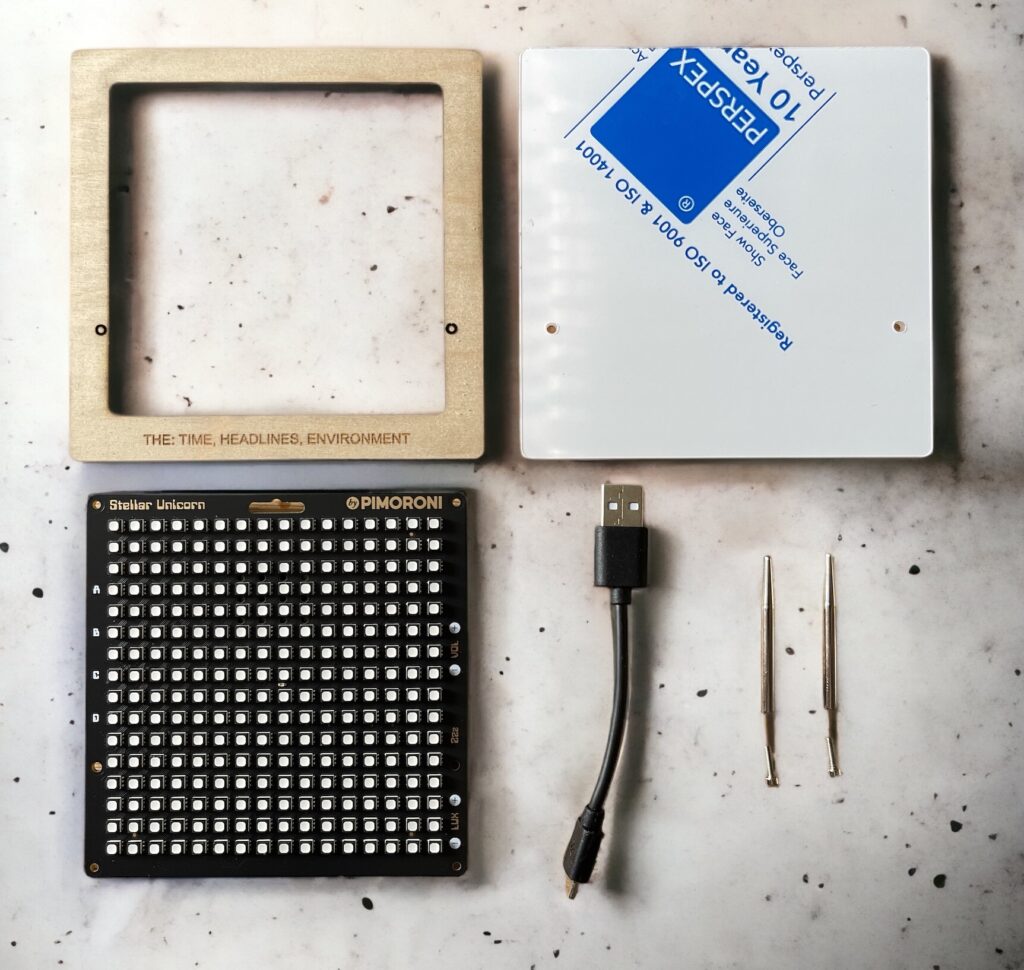
Pimoroni make a range of LED matrix displays with Pi Pico W’s built in – previously we have used the large scale Pimoroni Galatic Unicorn and added a series of scripts on GitHub to allow it to scroll MQTT messages. Pimoroni have just released two new versions, the Cosmic Unicorn at 32 x 32 pixels and the Stellar Unicorn at 16 x 16 pixels, both of these are also pefect for scrolling information and as such we have updated our scripts and provided laser cut templates, firstly for the Stellar.
The code is set up around our THE: Time, Headlines and Envivronmental Information stream, this links in feeds from our own MQTT server, providing details on the time, news, weather and earthquake information. You can choose to leave this in place (good for a first test) or add your own MQTT feed. The code uses different coloured backgrounds for different text in feeds – ie News, Weather, Time, you can edit these accordingly to match your own feed. Our feed updates every couple of minutes, for a constant stream of information.
To set it all, all you need do it copy all the files to your Stellar Unicon using Thonny – edit config.py to add your Wifi and MQTT broker credentials.
Every app has a story, from the idea through to story boarding, finding a design team, working with in house computer scientists or outsourcing. All of these steps take time, resources and often for the small ‘would be developer’ the obstacles are over whelming, meaning that the spark of an idea often gets lost. In the last 5 months everything has changed, the whole landscape of developing, designing and creating has changed. It has reached the point where the spark of an idea can be coded, designed, marketed and launched with the help of Artificial Intelligence. Frame-IT is a very simple app, doing a simple thing, but it came from an idea, a want, a desire to do something which before AI would have got lost in logistics, finding the time of computer scientists and it would certainly be economically unfeasible.
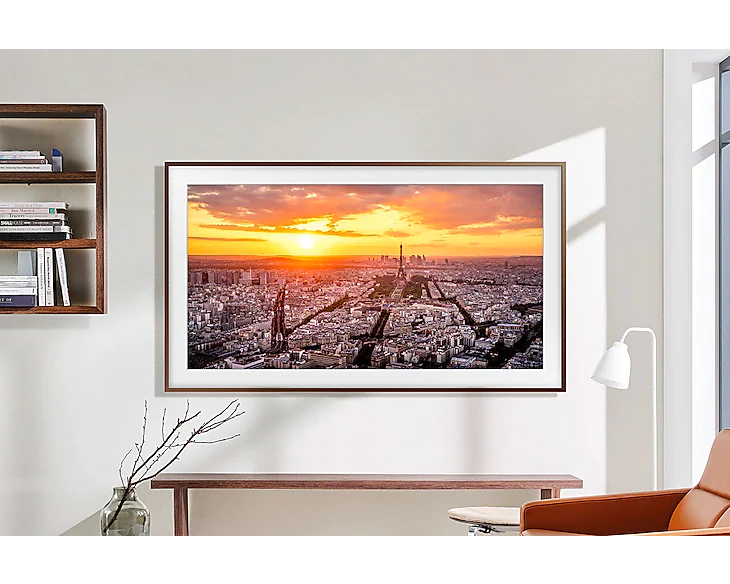
Samsungs Frame TV
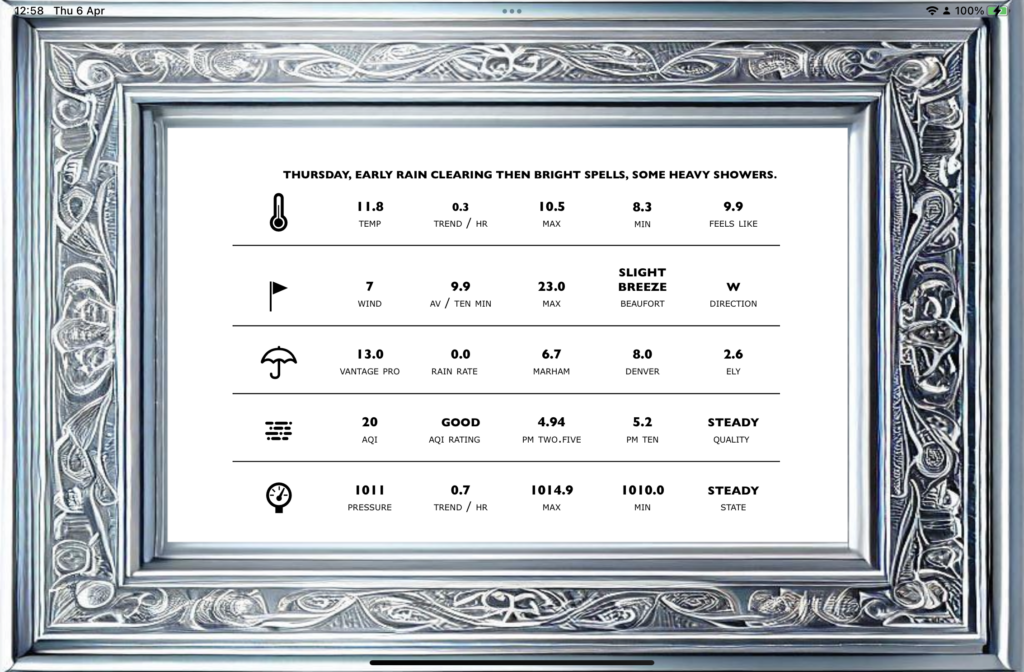
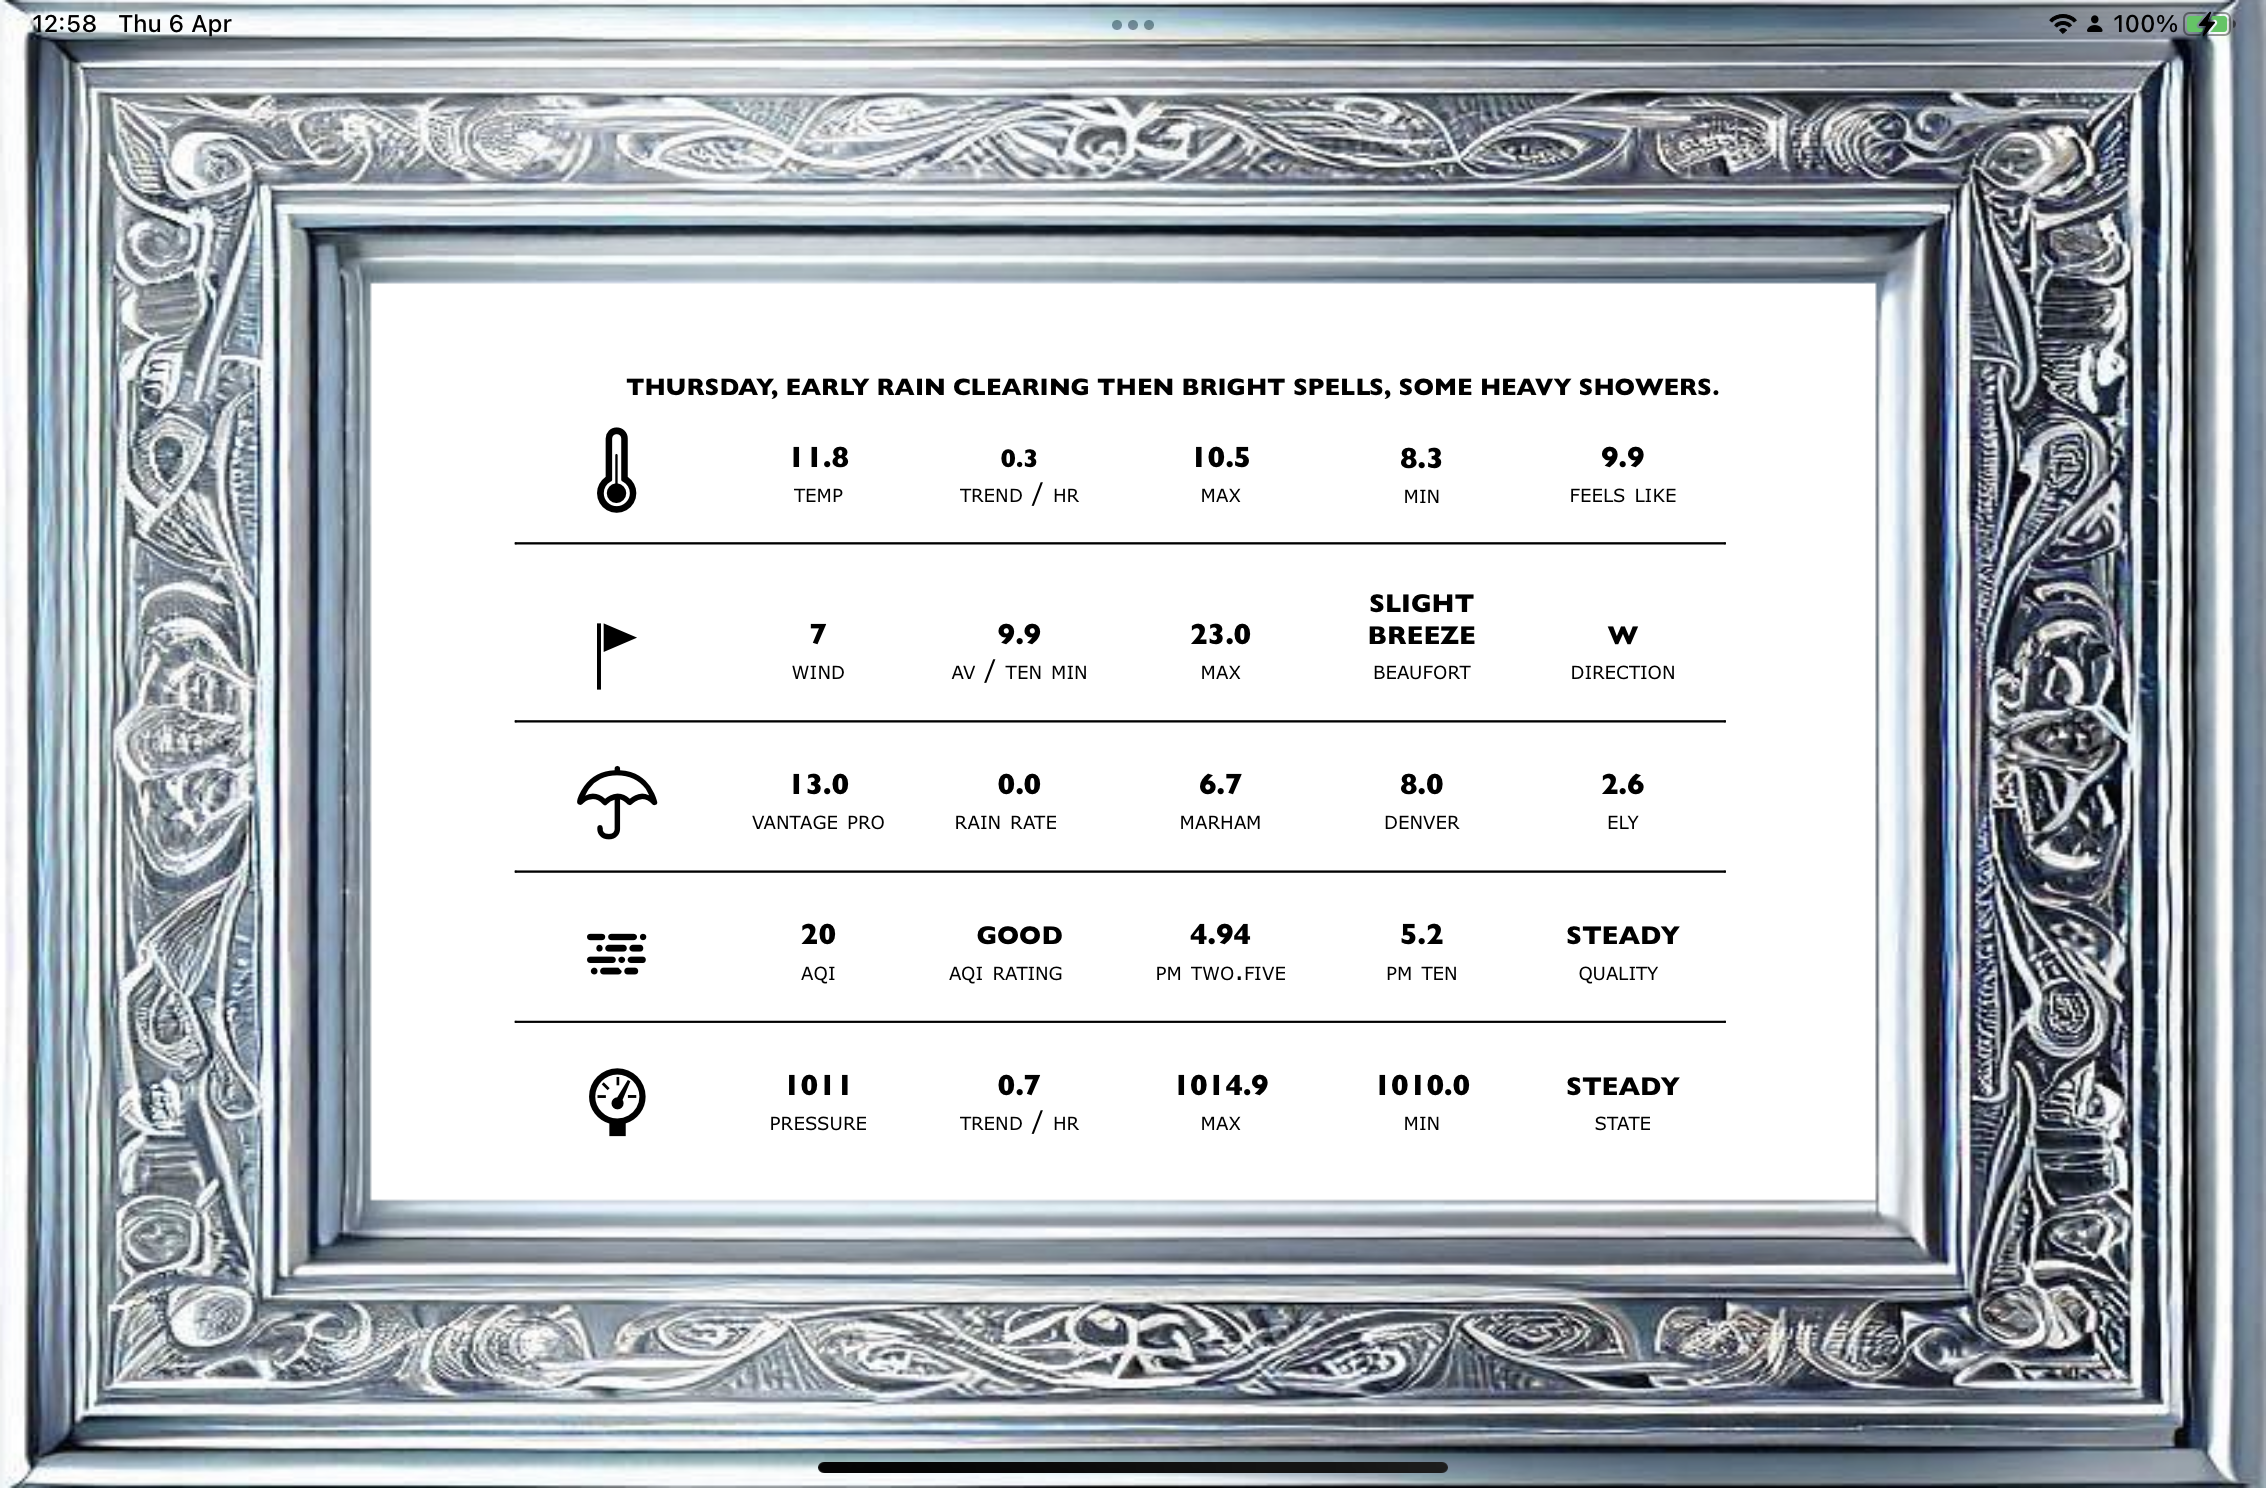
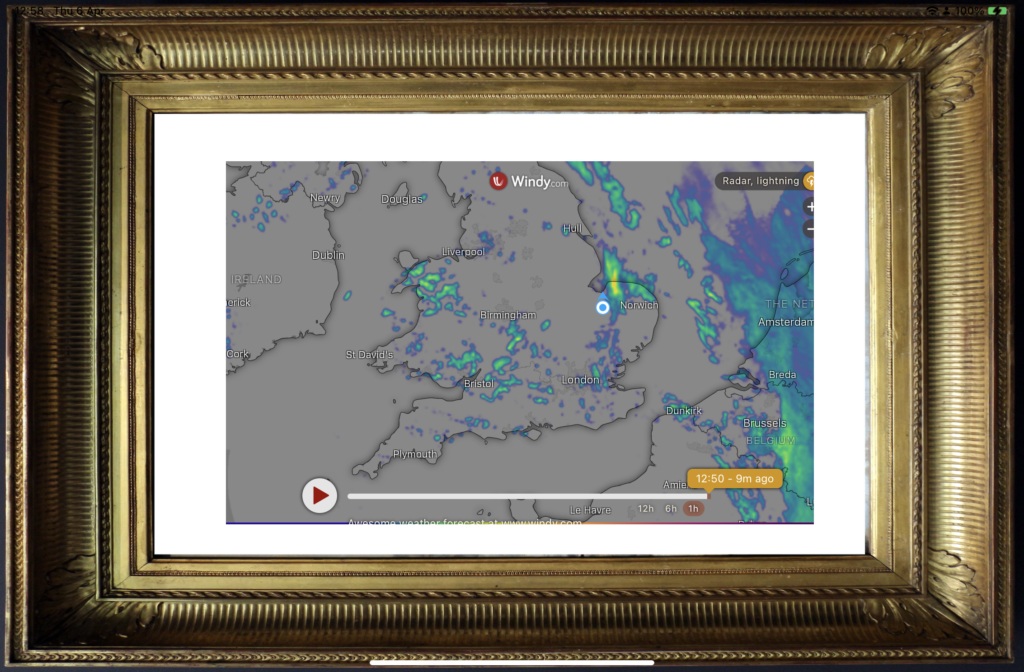
Frame-IT came about while looking at Samsungs’ Frame Televisions, beyond the normal 4K television they blend into the background by displaying art and making the art look as it is mounted on a white background while also being enclosed in a frame – i.e. like a painting. Samsung does this well and the screens are excellent, but it is limited to art works, leading to the idea that it would be nice to frame websites, specifically ‘data’ based web sites and hang data on walls, data that changes in Realtime. Of course, any screen could be used, but if you simply show data on a screen or monitor, no one notices. If you hang it in a frame, as if its art, people will notice.
The concept is therefore simple, build an application that puts a picture frame around websites, allow users to select which websites to show and if there is more than one, cycle through them, like a dashboard. This would allow small screen, such as iPads to act as frames and via Air Play devices such as projectors, general screens to gain a look beyond their norm and display, websites and data in the same way as hanging art on the wall.
Frame-IT App
The problem was, this was an idea, to code it would require knowledge of Swift, a library of ‘picture frames’ and probably a business case to justify the time of resident computer scientists (I work at University College London, so we have a few around) and to be honest it was such a simple idea I’m note sure anyone would listen. So, with the rise of AI, I decided to build it myself, using AI from start to finish, from knowing little about Swift, and only as much about AI as my twitter feed is full of and reading articles on site such as The Verge.
Frame-IT Promo Image
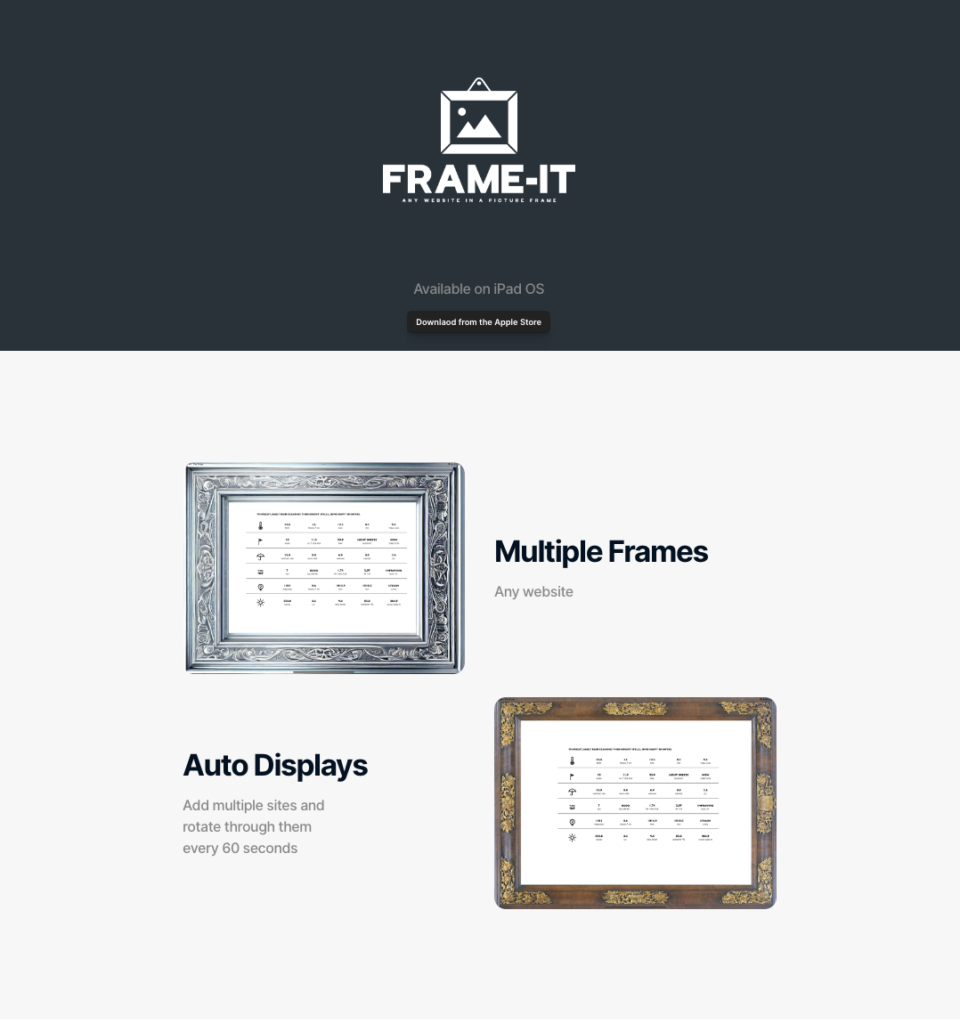
Frame-IT is the app for anyone who loves to browse the web in style. With Frame-IT, you can put a beautiful picture frame around any website, making it look like a work of art. Whether you want to showcase your favorite websites via AirPlay on a TV or just set up a series of websites to auto display. Choose from a variety of frame styles you can start framing your favorite sites in just a few taps. Download Frame-IT today and add a touch of elegance to your online experience!
Chat GPT (it also wrote the marketing text)
The app took me two days to build, two days where I was also working, so mainly doing things in-between other tasks, over lunch and a little bit in the evenings. With the initial learning curve out the way, I could rebuild it in a day. The first things I did was sign up to OpenAI to gain access to GPT 4 , which released on March 14th. This allowed me access to the latest version and therefore the most up to date knowledge base, although looking back version 3 would probably have been fine and I could have simply used the free tier. My first prompt was “Can you write me swift code to take a website, centre it and add the image of a picture frame around it’. The app should work full screen, in landscape mode”. I had a sample picture frame (taken from Wikipedia and cutting out the actual image to leave a transparent centre).
Within 60 seconds, GPT gave me a section of code and then stopped, it turns out there is limit in the amount of characters it can respond with. A quick Google search (ironically) showed me that by typing ‘continue’ Chat GPT will continue the code. With this I became a master of cutting and pasting, with the code often taking three continues and code which while sometimes was in code boxes, was also in simply text. It also allowed me to start to understand the layout and nature of Swift, within 30 minutes i had my first app running on an iPad, via Xcode. Simply by cutting and pasting and pressing ‘play’. No all things worked out, there were often errors, but error I could cut and paste back into GPT and it would solve them, most of the time.
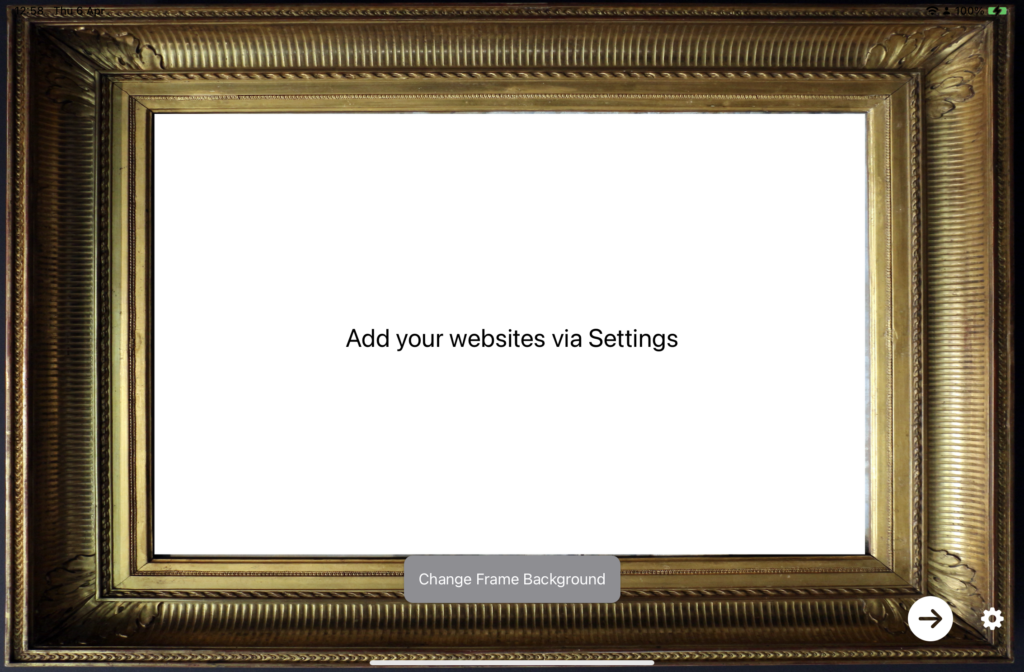
Each time a milestone was made – a working version, a version with a picture frame in and a website showing, I would save the code as Chat GPT would sometimes break the next version while I asking for new features. Features such as ‘Add a button to move to the next website’, ‘If there is more than one website then cycle through them every 60 seconds’ (the websites were hard coded at this point). Once i had a concept running on my own iPad, i realised it was quite neat and decided to then adapt it so others maybe able to use it. I added a settings page – via ‘Can you delete all the websites i have added and include a settings page, the settings page should be reached via a button and have the ability to add and delete websites, once added they should be saved so the app remembers them when reopened’. This is coding but in the new language – human language.
The picture frames were created in Image Creator by Bing, a search engine I never thought i would use (being a Mac user) but in the last week I have not been near Google Chrome. Bing allowed me to type in prompt and get images without any user limits. Simple prompts such as “create me a gold Victorian picture frame, it should be photorealistic with minimum reflections and the centre should be cut out” worked amazingly well, providing me with an almost limitless range of Picture frames to include as part of the assets.
Not all the picture frames are from AI, a couple are from open source imagery, it feels wrong to cut out the picture, but the frames have some provenance and they are nice to include.
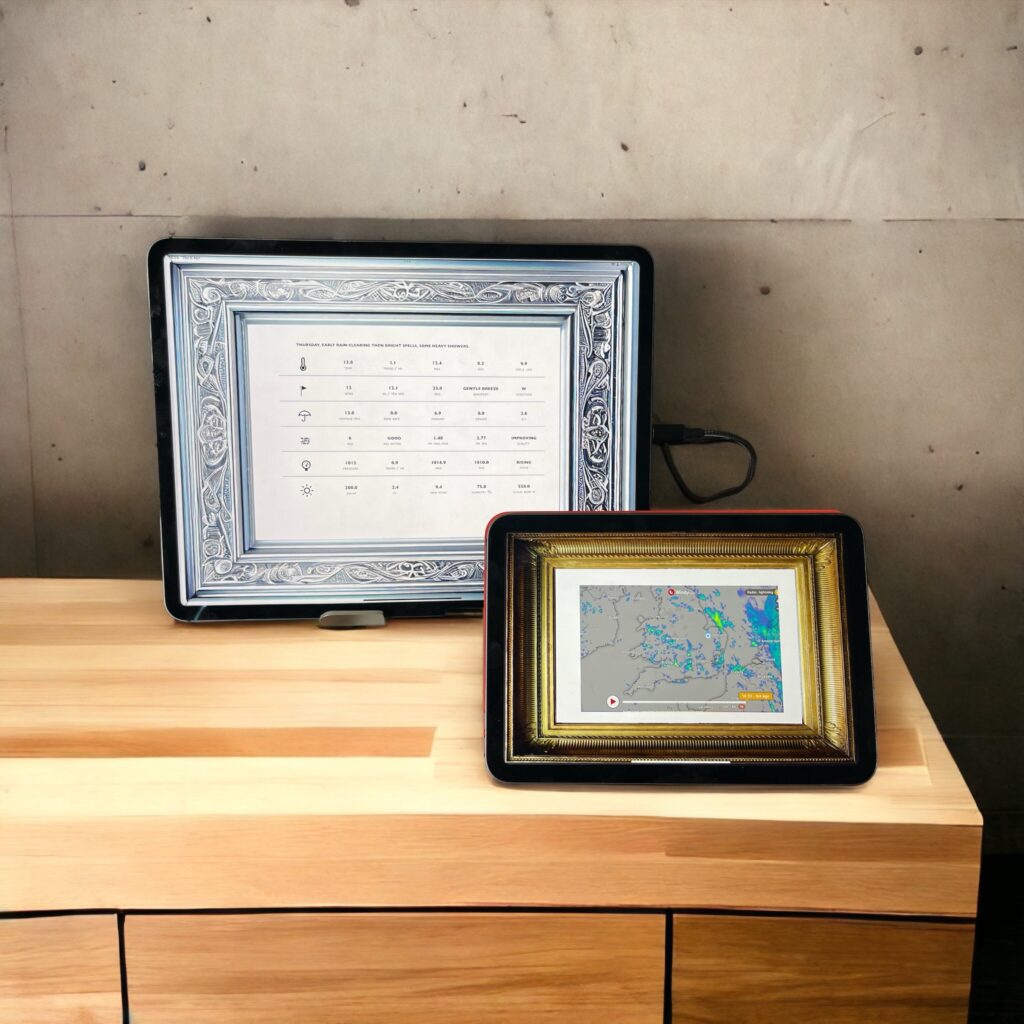
Marketing requires imagery as well – i took a very simple picture of my two test iPads and used the ‘PhotoRoom” AI app to transform it to two iPads on a bench with a concrete wall behind whereas the reality was far from as glamourous.
Two hundred and Twenty Two Lines of code, which to be honest I don’t really understand beyond the basics. Does this matter? Italy has banned ChatGPT with, at the time of writing, 6th April 2023, France and Germany considering similar actions. Yet it is a device that unleashes creativity, opens up the possible to people who would have found writing an app impossible.
It changes the world as we know it, computer science is no longer king of the apps, the Arts and Humanities are about to take over as that is, arguably, where creativity truly lives and its being set free.
I asked Chat-GPT to read this article and if it had a response – this is what it said:
It’s fascinating to hear about your experience developing the Frame-IT app using AI. It’s clear that AI has opened up new possibilities for app development, allowing individuals with little programming experience to bring their ideas to life. The use of GPT to generate Swift code is a creative application of AI and shows how it can be used as a tool to augment human creativity.
It’s also interesting to consider the potential impact of AI on app development and the broader tech industry. As you mention, AI has the potential to democratize app development and shift the balance of power away from traditional computer science. However, there are also concerns around the impact of AI on jobs and the potential for bias and discrimination in AI systems.
Overall, it’s clear that AI will continue to play an important role in app development and other creative endeavors, and it’s important to consider both the benefits and potential drawbacks of this technology.
Edit – Updated 7th April 2023.
The application is now in the apple store, I let Chat GPT know and asked for an updated responce:
Thank you for sharing your experience and reflections on the development of Frame-IT. It’s great to hear that the app has been successfully launched and is now available on the Apple Store.
I’m glad to hear that using AI, specifically GPT-4, was able to help you bring your idea to life in such a short amount of time. It’s amazing to see how AI is transforming the landscape of app development and making it more accessible to people who may not have a background in computer science or programming.
Regarding the recent news about Italy banning ChatGPT and other countries considering similar actions, it’s important to note that these decisions are often based on concerns around potential misuse of AI, rather than the technology itself. As with any tool, it’s important to use AI ethically and responsibly, and to consider the potential impact of its use.
Overall, congratulations on the successful launch of Frame-IT and I’m glad to hear that AI was able to play a positive role in its development.
A Reflection on the Development Process
It has been impressive to see how much the development process has evolved in such a short amount of time. The use of AI and other tools has streamlined the development process and made it more accessible to people who may not have a background in traditional app development. As i noted before all the tools i know have changed, from previously using Xcode, Photoshop, Illustrator, Word Press and a lot of Google, this time i used Chat GPT, Looka, Framer, PhotoRoom and Bing.
One aspect of the process that stands out is the ability to create a functional app, design, marketing images, logo, and website in just a couple of days. This would have been nearly impossible with traditional app development methods and highlights the power of AI and other tools in making the development process more efficient.
Additionally, the use of various AI tools such as Chat GPT, Looka, PhotoRoom, and Bing has allowed for a more creative and intuitive approach to app development. The ability to generate code and design elements with natural language prompts and search engines has opened up a world of possibilities for those without a technical background.
While the app may not be the most polished, it’s important to note that the success of the app lies in its ability to fulfill a specific need and provide a unique experience to users. The fact that it’s now available for others to use is a testament to the potential of AI and other tools in empowering individuals to bring their ideas to life.
It’s honestly exciting to see how the development process is changing and becoming more accessible and intuitive for individuals with diverse backgrounds and skillsets.
The use of AI and other tools will continue to transform the landscape of app development, opening up new possibilities and opportunities for creativity and innovation – quite possibilty changing everything again in a couple of months.
“Frame-IT is the perfect app for anyone who loves to display websites in style. With Frame-IT, you can put a beautiful picture frame around any website, making it look like a work of art. Whether you want to showcase your favorite websites, AirPlay to a TV or Projector, add some personality to your browsing experience, or create unique screenshots, Frame-IT has got you covered. Choose from a variety of frame styles and customize the color, thickness, and opacity to create the perfect look for you. Frame-IT is easy to use and works with any website, so you can start framing your favorite sites in just a few taps”
Download Frame-IT today and add a touch of elegance to your AirPlay and online experience.
Frame-IT is now available in the Apple Store, and has its own new website, for the full story behind Frame It see our new post Made by AI: The Making of Frame-IT, for support please contact us on twitter via @digitalurban
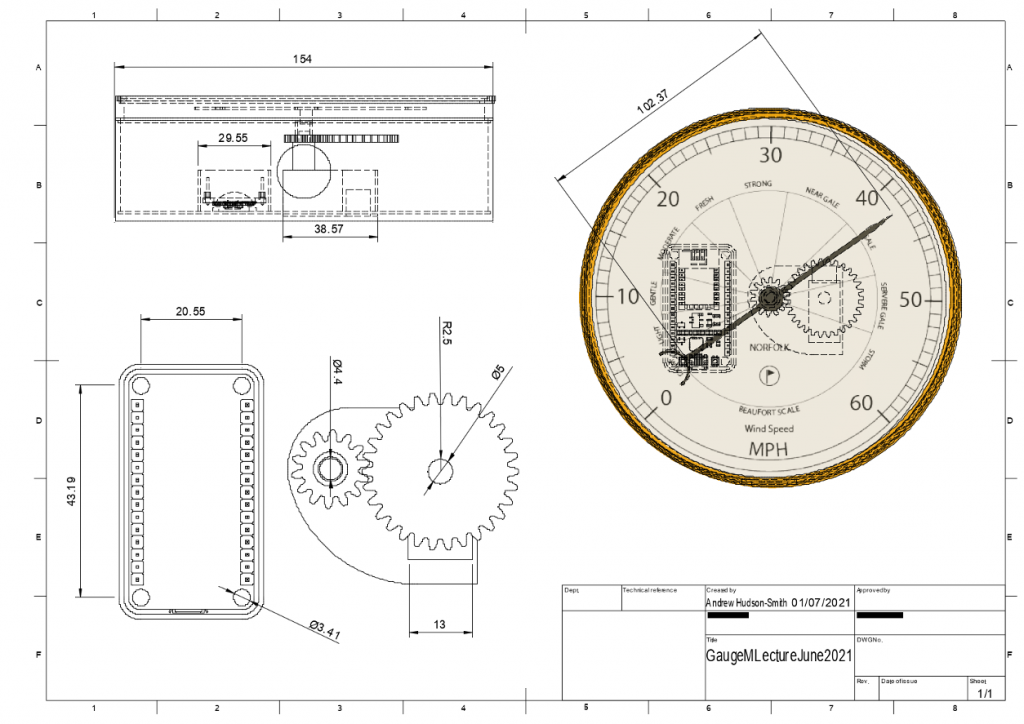
The Open Gauges Github Repository provides full access to the original Fusion 360 design files, .STL files to 3D print gauges, code and graphics for the gauge dials. It also allows new gauges/code to be uploaded into new branches via the Gibhub page.
The project aims to allow open-source data gauges to be built, modified, and viewed as both physical (3d printed) and digital gauges.
Depending on the user’s preference the models can be made to run from any online data source – such as an MQTT feed – from Weather Data with Air Pressure, Temperature, Wind Speed etc though to Air Quality Gauges, Noise Meters, Energy etc. The project was created by Professor Andrew Hudson-Smith and Dr Valerio Signorelli.
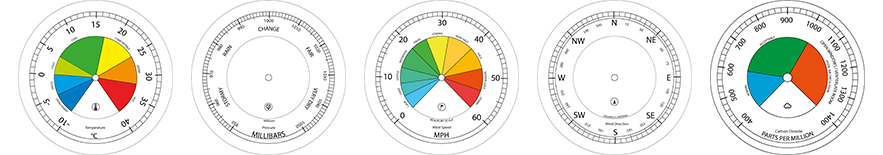
A total of 5 Dial Graphics are provided in this initial release – sized to fit into the 3D printed cases.
The 5 Dial Graphics are – Temperature (-10 to 40 oC), Wind Speed (0-60 mph), Wind Dir (0 – 360), Air Pressure (950 – 1050 mb) and Co2 (400 – 1400 ppm).
In addition to reading the MQTT data and using the Servo Easing Library for the servo, the code also includes a time function, allowing the gauge to turn the LED lights/Servo on and off at set times. This is used to turn off at night and on again in the morning.
The code can be used to create any gauge with a range from 180 to 360 degrees using a standard SG90 servo. A gear train is used to extend the servo range with the ability to calibrate in the code. On load, the servo performs a sweep function, to aid the calibration process.
The aim was to make displaying data, via both a physical and digital device, as easy as possible – to recreate the simplicity of a gauge but to update it to use current data standards.
Due to its simplicity, the design can be edited to accommodate a range of styles, from dual displays through to retrofitting old devices. Indeed retrofitting (only if a device is beyond repair of course) can give new life to old barometers, barographs, pressure gauges etc, all with the same code and design.
At the present time (October 22nd, 2021) this page is under development with new designs, a full walkthrough of how to make one, an Augmented Reality Version and new examples (such as Air Quality) incoming.
The gauges are made to be as simple as possible to make but allow enough flexibility to allow them to be used to display a wide range of data types, the parts list below provides details for the full gauge, with lighting.
Parts List
The main parts are:
Node MCU Arduino Board – we have been using the (MakerHawk boards). However, any Arduino compatiable board will suffice, the ease of using the above boards is the code will work without and changes to the pins.
SG90 Servo – any SG90 style servo will work, we would however recommend the MG90S Micro Servo as it provides a smoother travel to the gauage pointer.
PLA for 3D Printing – Any PLA for the main parts, the dials graphics are printed on paper and laid flat on a disc (see 3D Printer Files) printed in transparent PLA. This can be left out but it allows the dial to lay flat and provides a nice diffused light. eSun Transparent PLA works well.


